What is Curve Fitting?
Curve fitting or more commonly referred to as overfitting is creating a trading strategy that is too complex that it fails to adapt to new market data. Said another way, curve fitting is a trading strategy that shows a great backtest but fails on live data or as market behavior changes.

Curve-fitting is the fastest death for a trading or investment account once actual trading begins. Adding too many parameters and filters to improve your backtest feels good but rarely helps actual trading results in live markets.
Finding the perfect set of parameter settings to produce the perfect profit graph of past performance during strategy testing is a sure-fire way to curve fit and ultimately deplete your trading account.
Curve fitting is the black plague for system traders. The initial investment is often better donated than trading overfit strategies based on bloated hypothetical performance results.
In short, curve-fitting is finding patterns that are actually just random noise. As the curve fit trading strategy sees new data it will mistake random noise for predictive patterns causing trading losses. Preventing curve fitting and finding statistically significant patterns may be the key to your trading career.

Why do Automated Trading Strategies Fail?
Most automated trading strategies fail due to curve fitting or overoptimization. There are numerous other factors, but overfitting and overoptimization are the prime suspects.
Beginning traders hunt for the holy grail strategy and get excited over “too good to be true” backtests or hypothetical trading results. Many think a profitable backtest means a license to print money and no financial risk.
Many say, “If I could find a set of rules or parameters that does well historically on a specific trading program then I will be set to achieve profits”. Unfortunately, the markets and trading do not work this way.
Too many algo traders focus on finding the perfect trading strategy based on hypothetical performance results with the highest profit instead of finding robust strategies that can withstand losses moving forward.
Robust strategies are ones that can withstand changes in market behavior and are not sensitive to small parameter changes (i.e., possess parameter stability). Additionally, robust strategies should pass a series of robustness tests that many traders are unaware of.
For those curious, I covered all these in detail here: Robustness Testing Trading Guide
Here are the 3 simplest ways to lower or avoid curve fitting risk
1. Out of Sample Testing
Out of Sample testing is simply withholding some data in your historical data set for further evaluation. For example, you have ten years of historical data and opt to put the last 30% in your back pocket.
You develop a great trading strategy on the first seven years of the data set – the in-sample data. You add filters, subtract rules, optimize parameters, etc. Once the strategy results are acceptable, whip out your “out of sample” data (the remaining 30% from your back pocket) and validate your findings.
If the strategy fails to produce similar results on the out of sample data, then you can be almost certain you have curve-fit to the first seven years of your data set.
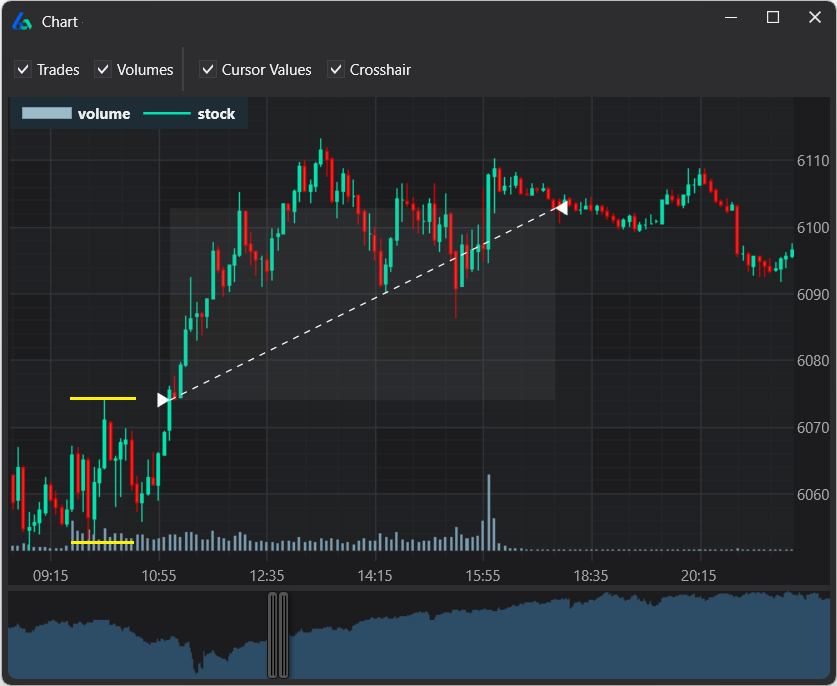
Below is a chart of an example strategy built using Build Alpha that highlights the out of sample period.

You like to see similar growth (and performance metrics) in both the in-sample and out-of-sample periods as sharp differences are often a red flag the hypothetical trading record was misleading.
On the other hand, successful OOS results are not necessarily indicative of future results and still involve financial risk but are a great first step to avoid overoptimization.
To read more about Out of Sample testing check out these blogs:
2. Sufficient Sample Size. Large number of trades
The second example of how we can reduce overfitting and hopefully our financial risk is to make sure your strategy has enough trades. If you flip a coin 10 times and it lands on heads seven times you cannot be certain you do or do not have a rigged coin.
However, if you flip a coin 10,000 times and it lands on heads 7,000 times then you can have high confidence it is a rigged coin.
Below is a photo of only 30 coin flips and below that is a photo of six different trials of 100,000 coin flips. You can see after a large number of flips things tend to converge toward the true expectation or their expected value. This is known as the Law of Large Numbers.


Trading Example
Let’s take this particular trading program below; it has a remarkably smooth cumulative profit graph and averaged $170 in profit per trade.

However, if we track this trading strategy’s average trade over time, we can see that in the beginning, when our trust in the trading system is lowest, it is a bumpy ride and far from the $170 per trade average. It takes about 100 trades for the average trade to converge to the actual results or average we expect!

Most traders cannot stomach this short-term “randomness” and abandon ship. Traders that fall prey to strategy hopping never achieve profits and sadly never find out why. They never escape this short-term randomness.
My mentor explained this short-term randomness, long-term obviousness concept to me and a lightbulb clicked.
Escaping Randomness was the perfect title of my Chat with Traders interview where I discuss how to overcome trading randomness and why algorithmic trading can help traders think about markets and risk-taking in a more productive way. If you haven’t already, please check out Aaron’s wonderful work here: Escaping Randomness with David Bergstrom
3. Validate Across Other Markets
Test your trading system across other markets. If a particular trading program only works on one market, then it has a higher chance of being overfit than if a strategy performs profitably on a handful of markets.
I am not saying that a trading strategy that only works on one market is curve-fit – as there are many nuances, different players, and idiosyncrasies that exist within each market.
However, if a trading strategy performs across markets, then in such cases you can certainly have higher confidence that it less likely curve-fit than a strategy that only performs well on one data set.

A sign of robustness is the ability to generalize to other data and withstand losses or is at least generally prepared for changes in the data.
Testing across similar markets is an easy way of quickly getting a sample of how well a strategy generalizes to new data sets.
Think of the cat picture above. If we provide new data is this algorithm going to draw a dog? It is most likely not the next series of points. Testing on a new data set and not finding other animals would indicate that the cat was probably random.
Other methods to catch Curve Fitted Strategies before live trading
I cover most of these in the aforementioned Robust Trading Strategy Guide but here is a popular list for those eager traders looking for more than the three simplest material points to combat curve fitting risk.
These robustness checks identify curve fitting and overoptimization before the market does:
-
Vs Shifted
shift the start and stop time of each bar slightly. Re-trade the strategy on the shifted data sets. For example, hourly bars from 11:03 to 12:03 instead of 11:00 to 12:00.
-
Vs Noise
add and subtract random noise amounts to the market data. Re-trade the strategy on the noise adjusted time series
-
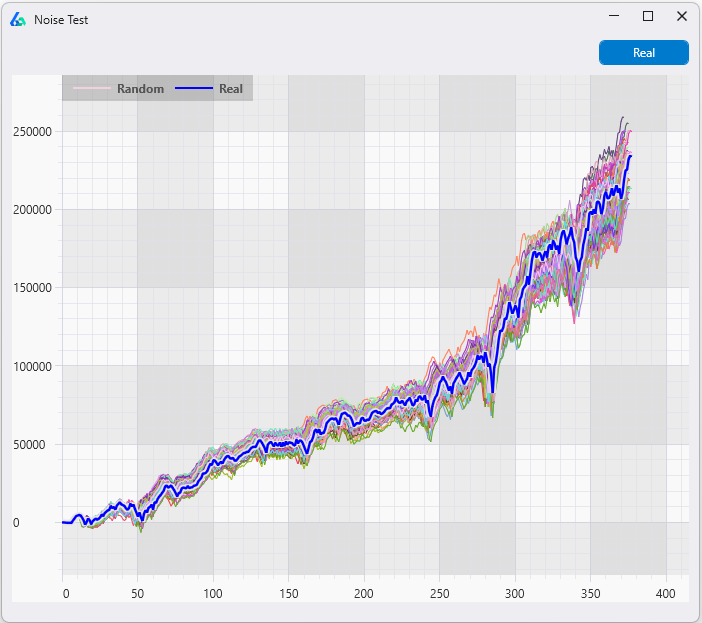
Vs Random
data mine for the best possible random strategy. Your strategy should beat this random benchmark if it contains true market edge
-
Monte Carlo Analysis
reshuffle and reorder the hypothetical trading results to see various paths the strategy could have taken. More on Monte Carlo Simulation here.
-
Variance Testing
resample from trade distribution only keeping strategies that have a performance metric some percent lower than the original backtest
-
Parameter Sensitivity Testing
trading systems that fail to show positive performance as parameters change are often curve fitted. For example, a moving average of 12 works but parameters of 11 and 13 result in substantial trading losses or losses similar to a random strategy.
-
Delayed Testing
trading strategies that cannot perform similarly with slightly delayed entries or exits are potential substantial risk candidates
-
Liquidity Testing
trading strategies that are capacity constrained and cannot handle large amounts of capital are also potentially over fit models that will fail in live market trades
How can I reduce the risk of Curve Fit Strategies with Build Alpha
Build Alpha is professional algorithmic trading software that generates, tests and codes trading algorithms with no coding necessary. It is truly a no code algo trading software rich with features.
However, a large part of my research and testing over the past decade-plus of professional trading experience and software development has helped me develop and integrate these robustness tests into one piece of software – that is Build Alpha’s strength.
Build Alpha has all of the above listed tests available at the click of a button for use on any trading system it generates.

In plain English, there are many inherent limitations, and no amount of stress testing can completely account for curve fitting risk; however, as traders, all we can do is attempt to lower the probabilities that we have fit the data. Powerful software like Build Alpha exists to help traders easily test and validate trade ideas prior to exposing them to the market.
Many factors related, but avoiding overly optimistic hypothetical performance results, strategies with frequently sharp differences between testing periods, and highly sensitive parameter settings are good rules of thumb. However, it is important to use the robustness tests as much as possible as “eye-balling” has never been a solid approach to the markets.
Build Alpha comes complete with the litany of Robustness tests mentioned in this article. You can even import your own custom strategy to test inside Build Alpha.
How to avoid curve fitting in forex trading?
I get asked specifically about forex strategies and overfitting quite a bit. There are a few reasons I believe this to be a larger problem with forex trading than other asset classes.
First, forex has no central exchange, so fills are subject to the broker and essentially a function of his desires. Your historical simulated prices, backtest fills, and what happens in live can vary quite a bit.
Second, there are many forex scammers (I mean vendors) peddling overfit trading programs. The hypothetical performance results almost always differ from the actual results subsequently achieved in real markets. You can usually spot these guys by the too perfect equity curves and no knowledge of robustness testing.
This experience is not unique to forex markets but is certainly most prevalent here. There are other inherent limitations with buying trading systems, but this is not the place to discuss. It is best to build and test your own, so all risks are fully accounted for!
Curve Fit Key Takeaways
- Past performance is not indicative of future results!
- Curve fitting is a “too perfect” backtest that fails in actual trading
- Curve fitting is the bane of most algo traders. Adversely affect trading results
- Out of sample data is a first line of defense as it acts as unseen data
- A large sample size of trades helps reduce the chances of finding something lucky
- Validating across additional markets is a strong sign of robustness
- There are more than three methods to help reduce the chances of curve fitting. Read more here: Robustness Testing Complete Guide
Three ways to reduce Curve Fit Risk Summarized
- Out of sample testing
- Require large sample size of trades
- Test across other markets
Summary
Algo traders constantly battle the market’s complexity with their own complexity often leading to curve fit or overfit strategies which cause substantial risk to actual trading results.
Overfit trading strategies are frail, too good to be true strategies that fail when the market changes or a particular trading program is exposed to new market data or market conditions.
Over optimizing parameters or memorizing material points of the historical time series are the common culprits of failed accounts. Is it avoidable?
Traders can use robustness tests and methods on trading systems to help reduce the chances of overfitting such as:
- out of sample testing
- ensuring a large enough trade count
- testing their trading strategy on various different markets
These tests do not guarantee trading systems are not a fitted curve but function to help reduce the risk of curve fitting in the market. Build Alpha aims to make this identification and testing easy and with no coding necessary.
Thanks for reading,
Dave
Author

David Bergstrom – the guy behind Build Alpha. I have spent a decade-plus in the professional trading world working as a market maker and quantitative strategy developer at a high frequency trading firm with a Chicago Mercantile Exchange (CME) seat, consulting for Hedge Funds, Commodity Trading Advisors (CTAs), Family Offices and Registered Investment Advisors (RIAs). I am a self-taught programmer utilizing C++, C# and python with a statistics background specializing in data science, machine learning and trading strategy development. I have been featured on Chatwithtraders.com, Bettersystemtrader.com, Desiretotrade.com, Quantocracy, Traderlife.com, Seeitmarket.com, Benzinga, TradeStation, NinjaTrader and more. Most of my experience has led me to a series of repeatable processes to find, create, test and implement algorithmic trading ideas in a robust manner. Build Alpha is the culmination of this process from start to finish. Please reach out to me directly at any time.