What is Algorithmic Trading?
Algorithmic trading is the act of placing buy and sell orders through a computer. The trading strategy rules can be defined and given to a computer to execute whenever the entry and exit conditions are true. Algorithmic trading can also be referred to as algo trading, automated trading, systematic trading, or mechanical trading.
Algorithmic trading, or algo trading, is the fastest growing trading style as reports already show
- 60-73% of all U.S. equity trading was done via algorithmic trading in 2018
- The algorithmic trading market is growing at a CAGR of 11.23% between 2021-2026.
Read more key algo trading stats here.

Algo trading can be applied to any market, timeframe or holding period. Many traders incorrectly assume algorithms only apply to day traders or high frequency traders. All high frequency traders utilize algorithms, but swing traders and longer-term investors may also take advantage of automated trading.
In this complete guide, I will use my decade plus of professional algorithmic trading experience and years of developing Build Alpha to walk you through the
- basic principles
- simple trading frameworks
- sample strategy types
- portfolio construction
This guide is for traders looking to get into algorithmic trading as well as those well versed.
Can you make money with algorithmic trading systems?
The most common question I receive is, “can you make money with algorithmic trading”? First, the leading 12 investment banks earned about $2 billion from the portfolio and algorithmic trading in 2020, according to Coalition Greenwich. Check out the key algo trading stats link above.
Second, the world’s best hedge fund, Renaissance Technologies, is a large proponent of algorithmic trading systems and automated trading systems generating 66.1% average annual return since 1988.
James Simons (full length interview) – Numberphile – YouTube
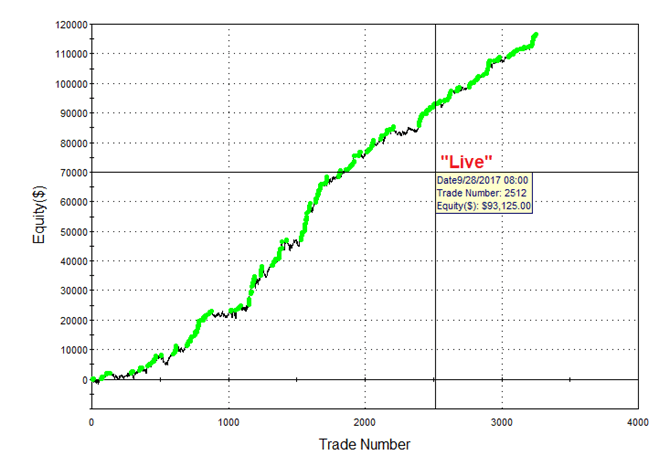
Furthermore, here is a Registered Investment Advisor client with over $100 million in AUM who shared returns of a few of his clients.


Also, plenty of individual traders can do quite well. There are no limits or restrictions for account sizes. Here are some statements from Build Alpha traders using algorithmic trading strategies with all different account sizes.


Here is a simple strategy that was given away many years ago that continues to do well. This strategy may be too simple as a standalone, but a great idea of what building blocks are possible with algo trading.

It is important to note that all trading, automated or not, involves risk. Additionally, trading returns are often a function of the risk taken. Finally, markets change, and strategies should be monitored on-going. Please respect risk and compete against yourself, not against another trader with a different bankroll. There will be more on risk, monitoring, and position sizing below.
What are the benefits of algorithmic trading?
-
More markets A trader can only watch so many charts at a time. Algorithmic traders can cover more markets. More opportunity means more edge. More uncorrelated edge should mean more profit; more on this later.
-
Smarter risk-taking having rules can help avoid taking unnecessary risk when the market data does not support risk taking. If the data supported it, then you would probably have an algo trading system already.
-
The computer never sleeps fatigue, burnout, hangovers, etc. all play into a manual trader’s profit and loss and buy and sell orders. We all have times where we could have used a couple Z’s. Computers don’t.

-
Fewer mistakes a wrong hot key, buy instead of sell, fat finger an extra zero, a wrong symbol. It is rare, but trading is hard enough as it is. Avoid these mistakes by using automated trading.
-
Quantified edge trading rules can be backtested and quantified. How much can I expect to make in the next N trades? How much can I expect to lose in the next N trades? Quantifying leads to smarter trades.
-
Less emotions angry at the reality of losing hard-earned money? The next trade after a difficult trade can make or break your month if you are not careful. Automated trading avoids trading on tilt and revenge moments. Human traders can benefit.


-
Rule based [left brain] Having clear trading rules, expectations for profit and loss, and treating trading as a quantifiable endeavor are intensely satisfying for left-brains as this is their modus operandi elsewhere.
-
Creative [right brain] traders can get lost (in a creative way) in the process of developing an algo portfolio. Developing a new algo can be as, or more, gratifying than making a profitable trade due to the creativeness the development process evokes.
Can you automate stock trading? Can you automate ETF trading?
Stocks and ETFs are the most popular markets and can certainly be automated. The sheer number of symbols and unique companies presents seemingly endless opportunities for algorithmic traders to capitalize on. The 6.5-hour trading day from 9:30 ET to 16:00 ET are perfect for most traders but even better for algorithm traders. Automated stock traders can review pre and post market results and contain their workday within normal business hours.

Stocks and ETFs do present larger gap risks as unscheduled or surprising news can be released during hours where markets are closed. Since computers never sleep some automated traders feel no need to subject themselves to these risks and explore other markets.
Can you automate Futures Trading?
Futures markets are arguably the favorite market for automated traders. Futures such as equity indexes, gold, oil, and other commodities like corn, wheat, and lean hogs all trade much more frequently than stocks and ETFs; most futures contracts trade nearly 23 hours a day, 5 days a week. This extended trading schedule certainly lends itself to more algorithmic traders and the need to automate.
To learn more about futures read my Brief Guide to Futures I wrote a few years ago or check out futures contract specs on the exchange websites. Here are the specs for the S&P500 emini futures contract.

Additionally, Futures follow the 60/40 tax rule which taxes the first 60% of gains as long-term capital gains and the remaining 40% at ordinary income rates. Remember the lowest two ordinary brackets for long-term capital gains are 0% so futures provide excellent entry points for small account traders looking to compound their gains while minimizing the tax hit. To read more check out the Section 1256 contract rules.
Can you automate Forex Trading?
Foreign Exchange (Forex) is trading one country’s currency for another and trades 24 hours per day, 5 days per week. This around the clock schedule is perfect for automated trading. Forex is often quoted or displayed as six letter symbols such as EURUSD where if the trader were to buy EURUSD pair he would be buying euros (EUR) and selling dollars (USD). Forex does not have a central exchange the way that stocks and futures do. That means, the forex execution price is often left up to the forex trader’s broker dealer (more on brokers later). It is important to note that futures contract equivalents of most of the major forex pairs do exist.
Can you automate Crypto Trading?
Cryptos trade 24 hours per day, seven days per week, and 365 days per year. Talk about the need for algorithmic trading! For this reason, algorithm trading is very popular among crypto traders.
For those that are unfamiliar, crypto Currencies are digital or virtual currency that uses cryptography to secure transactions. At the time of writing this, the largest market capitalization coins are Bitcoin and Ethereum. Most of crypto currencies are built upon blockchains or online digital ledgers that track all the transactions of a cryptocurrency in public purview. To search for the largest cryptocurrencies, I would recommend using Coin Market Cap.

What kind of Data is needed?
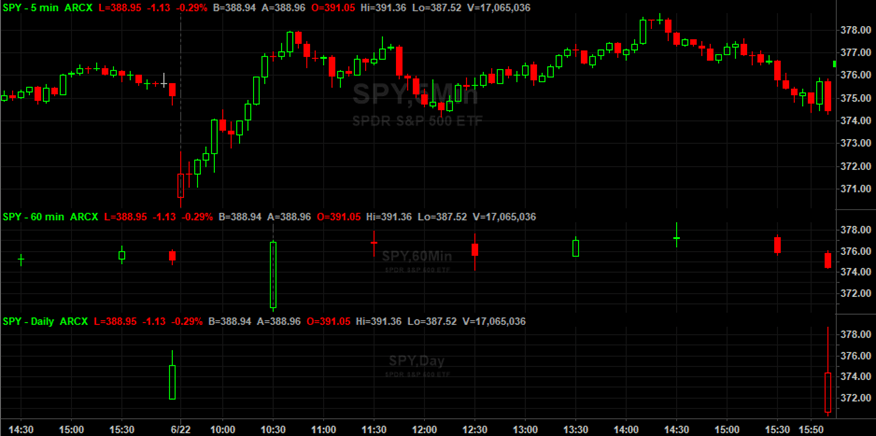
Market data is the lifeblood of algo traders and comes in many forms. Regardless of the market, the most common form of data are time-based bars. Each bar contains a time interval’s Open, High, Low, and Closing price. These bars are often referred to as OHLC bars.
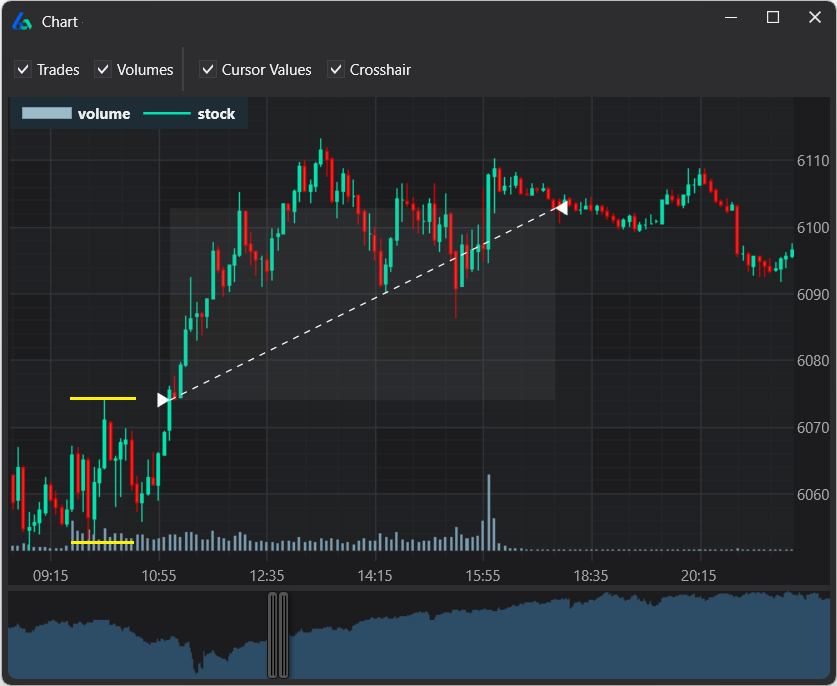
Bars come in all timeframes such as 5-minute, 15-minute or 60-minute bars. 15-minute bars simply means that one bar occurs every 15 minutes and at the end of 15 minutes another bar begins. Here is what a sample data file and OHLC chart look like:


There are many great free sources of daily financial data for all financial instruments. Here are a few free S&P500 daily data sources:
- Yahoo.com : S&P 500 (^GSPC) Historical Data – Yahoo Finance
- Dukascopy.com: Historical Data Feed :: Dukascopy S&P 500 Data
- Investing.com: S&P 500 Historical Rates (SPX) – Investing.com
Side note: Build Alpha does come with a full database of all markets, 1 minute up to daily, weekly, monthly for all symbols.
What Type of Programming Language is best for algorithmic trading?
Excel
is expanding by creating functionality to retrieve live stock prices in Excel. Excel was my starting point into quantitative trading and allowed me to view price data, calculate indicators, and build some rudimentary backtests. For longer-term trading, excel is a suitable solution. However, you will quickly outgrow excel when you need faster testing.

Python
is the fastest growing and most popular programming language. First, python code simpler to read and learn than any other language as python is known for its simple syntax and easy-to-read code. Second, many public code libraries are posted all over the internet. Odds are someone already built a python library for your idea. Don’t reinvent the wheel – just use the existing python library. Third, it is easy for data science and machine learning which many professional quantitative traders utilize daily.

Python’s drawback is speed. If you want to search large intraday datasets, then python is rarely the best choice. If you are interested in seeing a concrete example of building a trading signal in Excel and Python then please check out: How to Build an Algo in Excel, Python, Build Alpha

C++
is the fastest, most robust coding language. It is widely considered the best choice for competitive programming by 75% of programmers, according to Geeks For Geeks: Why Cpp Is Best. However, the added benefits of C++ come from the steep learning curve and complex syntax used. My market maker, high frequency trading mentor started me with C++ but there are definitely easier starting points in hindsight.
-
Most will not need the speed and reliability of C++ and it is often best reserved for professional quants, high frequency trading, and those looking to quickly test trading ideas across tons of data.
No Code
If you do not want to program, then keep reading to learn about Build Alpha – no code algo trading software.
What is a trading broker?
A broker is an intermediary between those who want to trade and the exchange. You need a broker because exchanges require those who execute trades on the exchange to be licensed. Brokers typically charge a small fee, referred to as a commission, for their service. However, many brokers have begun offering $0 commissions.

What is the best trading broker for algorithmic trading?
The brokers I recommend for algorithmic trading are TradeStation and NinjaTrader. Let me breakdown the pros and cons as well as some feedback from the Build Alpha community.
TradeStation
is an award-winning broker well known for their trading platform and proprietary coding language Easy Language. Easy Language is a simplified language created to help traders code. Traders can create strategies with much less effort than a traditional coding language. TradeStation also has beautiful charts and a relatively fast platform.
If you are interested in opening a TradeStation account, please contact me and I can put you in touch with the Build Alpha rep. TradeStation is assisting new traders get started with Build Alpha. Ask me how.

NinjaTrader
is a fast-growing broker that also has their own coding language called NinjaScript. NinjaScript is a simplified version of C# but is a bit more complex than TradeStation’s Easy Language. The added complexity does come with additional benefits and flexibility albeit with a steeper learning curve. NinjaTrader also has a great ecosystem of third-party vendors who release indicators and other trading tools.

Both TradeStation and NinjaTrader allow you code strategies in their proprietary coding languages and automate them directly inside their trading platforms. I know, what if you can’t code? Keep reading!
How to automate my trading system? Coding to Broker or no coding to broker.
You can code your strategy in Python or C++ (or any other language) and connect to a broker’s API or application programming interface. An API is essentially a public library that explains how your code can communicate with someone else’s code.
Both options above are for programmers and those traders with the appetite to learn programming. Coding strategies yourself can lead to errors and has a steep learning curve. Certainly, a measure twice to cut once endeavor.
But what if you do not want to write code? You need strategy testing software that builds algorithmic strategies and generates code for you. Does that exist? Yes. Automate your trading with no coding.
What is the Best Algorithmic Trading Software?
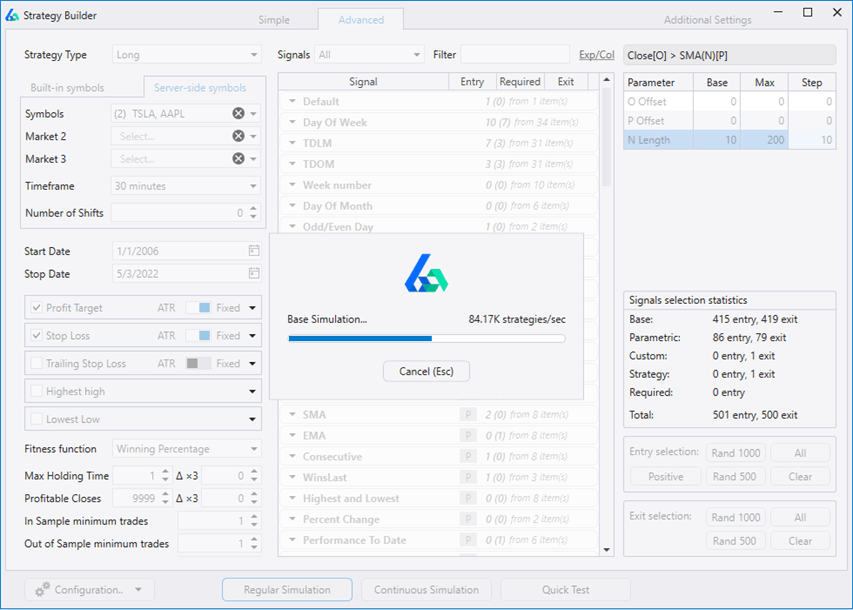
Build Alpha Strategy Builder
Build Alpha is built after my own hardships learning to code and the need to test an endless stream of trading ideas in financial markets.
Instead of coding every single trading idea, I thought I would build software that could test all my ideas at once with no coding.
Build Alpha allows the trader a point-and-click interface to select
- symbols
- date range
- entries and exits
- stops and targets
- filters and regimes
- add your own custom signals
and then passes all inputs to a genetic algorithm which will find the best algo strategies for you.
For traders that do not have time to learn to code or want to test their trading ideas faster than coding can enable, then Build Alpha is the answer. Check out the Build Alpha homepage or request a demo.
What are the types of Algorithmic Trading Strategies?
Different trading rules will create different trading system styles and characteristics. Let’s breakdown the two most popular trading strategy frameworks and their associated characteristics.
Trend Trading
is a trading strategy that attempts to capture large directional moves or continuations in price trends. Trend trading will hold the trade until momentum shifts and is most popular among the swing trading and longer-term trading accounts. The simplest form of trend trading is buying when price crosses above a simple moving average and selling when price falls below a simple moving average. Trend Trading is often characterized by frequent small losses and infrequent large wins. The large infrequent wins often make up for the small infrequent losses.

A quick algorithmic trading history lesson: The Turtle Traders were 23 novice traders who became literal millionaires overnight in the 1970s due to a trend following strategy. Two professional traders and industry experts shared their strategy with these novices to test the novice traders’ discipline. It is an amazing story, and the strategy is well known now after being detailed in books. The strategy is not quite as successful over the most recent decades, however.
Mean Reversion
often called countertrend, trading looks to capitalize on extreme moves in price action assuming price will revert to its average price. Mean reversion can be thought of as the opposite of trend following. Mean reversion can be simply described as a deviation away from a simple moving average or previous average price with the assumption price will return to its average price. As price moves away from the average, traders would look to buy (or sell) shares until price returns to the average. Countertrend trading is often characterized by small, frequent wins and large, infrequent losses.

Are there different types of Algorithm trading?
There are many different types of trading algorithms and many will be left out of this guide to keep this comprehensible. There are a handful of other common algo trading styles worth noting.
Seasonality
According to Investopedia.com, seasonality is a characteristic of a time series in which the data experiences regular and predictable changes that recur every calendar year. A simple example is retail stocks catching a bid before holiday sales numbers or energy stocks selling off after a mild winter. Seasonal trading is the most basic kind of trading rules we can define because it is as simple as buy on this day of the year and sell on this day of the year.

Breakout Trading
is a subset of trend trading. A breakout occurs when price breaks above a significant past price level. Many technical analysts and chart pattern traders enter on breakouts. Traders must be sure to quantify the set up and breakout to truly understand if the breakout is a repeatable edge and works across symbols. Most breakout traders look to exit quickly instead of riding the potential ensuing trend.

Price Action Patterns
This style is best described in Jack Schwager’s book Hedge Fund Market Wizards,
“This category of systematic approaches whose signals do not seek to profit from either continuations or reversals of trends. These types of systems are designed to identify patterns that suggest a greater probability for either higher or lower prices over the near term.”
Simple examples would be if today’s close is below yesterday’s low or if today’s high is above the previous two day’s highs. These price patterns can often be combined to gain a sense of where the market is likely to go next.

There are various other types of trading styles. Here are a few more (not an exhaustive list). However, these are not great starting places.
- Pairs trading
- Index fund rebalancing
- Statistical Arbitrage
- Market Making
- News or Event Driven
How to get started with algorithmic trading? What signals are best for automated trading systems?
Price Action
is comparisons of open, high, low, and close data. The close is higher than the close two bars ago or today opened above yesterday’s high. Candlestick patterns are variations of price action; however, they often have misleading names that do not match the data as I pointed out here: Trading Truths.

Fundamentals
Is the company growing revenue? Are margins expanding? Is the company reinvesting? Quantifying fundamentals is great for institutional investors but rarely used for short-term trading. Public companies are only required to give updates once per quarter.
Technical Analysis Indicators
like volume weighted average price (VWAP) and Stochastics provide price summarizations. I have done many tests with technical analysis, and there is no holy grail. One technical indicator may provide value on a certain symbol or timeframe but may show completely different results on another. Here is a quick video I did on technical indicators: Build Alpha Auto Trading Software testing RSI and MACD Strategies.
Chart patterns
are geometric shapes connecting price levels. Traders draw these lines under the assumption price consolidates before an explosive move. It is important to quantify and test chart patterns. I worked with a PhD in geometry to quantify chart patterns as signals in Build Alpha. Here are the most common chart patterns:

Intermarket
Perhaps you only want to trade stocks if gold is doing XYZ and avoid stocks if bonds are doing ABC. These inter-market relationships are extremely powerful and popularized by the late Murray Ruggiero. His book Cybernetic Trading Strategies is still one of my favorites.
Multi-timeframe
Analyzing what a symbol is doing across timeframes may also lend key insights or confirmation to take a shorter-term trade. For example, enter a long position on the 30-minute if the daily and weekly charts are trending up.
Additional and Alternative Data to Give Context to Trading Algorithms
Economic Data
How healthy is the economy? Is Gross Domestic Product expanding or contracting? Is employment strong or is a recession looming? Deflation or inflation? Any of these factors may influence if we are long or short or what markets we should trade.
Market Breadth
can give insights into what is happening under the market’s hood. How healthy is the market? How many S&P500 stocks are trading above their moving average? Do we notice lots of buying activity on exchange or is most in dark pools? What percent of stocks are near all-time highs?

Risk Factors
watching the volatility index, VIX, can help gauge traders’ and market makers’ appetite for risk. If VIX is spiking, then perhaps trading styles should change. Maybe VIX above a certain level should activate hedging algos. Ignore the market’s risk readings at your own peril.
Options Flow
Understanding options can provide an edge to your strategy development. Options metrics such as risk reversal pricing, gamma exposure, and the relationship between implied and realized volatility can add needed context to trading the underlying securities. How are market makers and dealers positioned? Do you want to fight the tide or ride the wave?
Alternative Data
many professional traders and firms utilize alternative data with price data. This extra data can give their algorithms insights the price data cannot. Alternative data can include scrapping job postings to see who is expanding, tracking rail car weights and shipping cargo weights, monitoring satellite images over parking lots to gauge production levels, sentiment data scraped from twitter, etc. Creativity can often win the day. Build Alpha was designed to accept alternative data as I know how flexible traders need to be.
Backtesting Algo Trading Strategies and Automated Trading Systems
To create a strategy, we need to have historical price data and pre-determined trading rules or signals. We can apply any trading rules to the data to generate the historical trade results – this process is known as Backtesting. I wrote a full guide on backtesting here: Backtesting Trading Strategies.
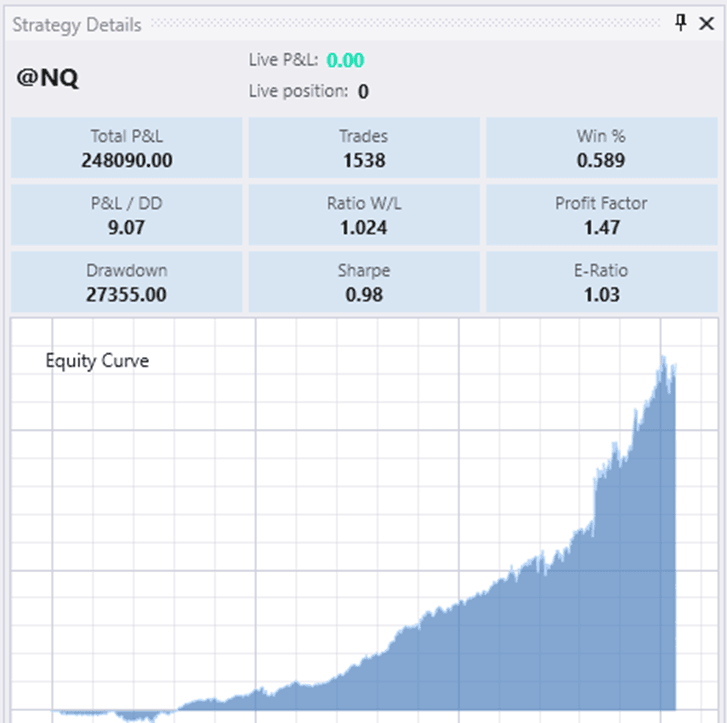
Build Alpha can create any strategy type we have discussed and generate our list of trades with automatic backtesting. We can also view:
- Equity curve – a profit and loss graph to show you how your account would have grown over time.
- Performance metrics – such as winning percentage, total profit, drawdown, profit factor, and more. These metrics will be covered in detail later.
- Ability to view trades on your chart – is an important aspect to make sure you understand what the strategy is doing.
What is the best strategy tester and backtesting software?
Build Alpha’s backtesting engine is extremely fast and unique as the code is written in C++ making it extremely fast and accurate. Accuracy is incredibly important when reviewing backtested results. I am extremely proud of this software as it helps me (and many other traders) quantify and view strategies in a matter of seconds.
There is no need to write any code to test your strategies as it is a completely code-free software. Simply select your entries, exits, risk management and hit Simulate. Build Alpha’s algorithm does the rest.
Algorithmic Trading Strategy Examples and Building Blocks
Losing money? Let’s backtest three example algorithmic trading strategies. All three focus on SPY, the S&P 500 ETF. Each strategy only contains one entry rule and is not optimized. I will leave optimization, adding filters, and testing on you the reader.
Price Action strategy example 1
- Today’s low is below yesterday’s low then buy the next open
- Sell after one day.
- This strategy beats buy and hold from 2006 through 2022.

Price Action strategy example 2
- 2-period Relative Strength Index (RSI) is below 20 then buy the next open
- Sell after the 2-period RSI closes above 80.
- This strategy has outpaced buy and hold while registering significantly less drawdown than the overall market.

Price Action strategy example 3
- Current bar closes in the bottom 20% of its daily range, then buy the next open.
- Sell after any day closes in the top 15% of its daily range.
- This strategy has also beat buy and hold over the testing period.

These three strategies are not meant to be standalone strategies, but act as an example to demonstrate how price action signals can provide a tremendous starting point to trading system development. All these strategies were tested using Build Alpha’s built-in signal library. The next steps could be to add filters, indicators, alternative context, etc. but first let’s explore performance metrics.
Best Algorithmic Trading Performance Metrics
After running a backtest to see the hypothetical trades, we can view performance metrics to help us determine how good our algo is. Below are the most common metrics every quantitative and algorithm trader should know.
Profit and loss or P&L
This is simply the total profit or loss generated by the strategy
Drawdown
the amount the profit and loss fell from its highest amount. If the strategy was up $10,000 and then later was up only $8,000 then this is a $2,000 drawdown. Often simplified to the maximum drawdown as many drawdowns occur.
P&L / Drawdown
is a metric comparing the total profit earned by the drawdown. The higher the ratio the better, generally speaking.
Win Percentage
is the percentage of trades that returned more than $0 divided by the total count of all trades.
Ratio Win to Loss
is a risk:reward metric comparing the average winning trade to the average losing trades. The higher the number the better.
Profit Factor
compares the total gross dollars made on winning trades divided by the absolute value of total gross dollars lost on losing trades. This value is a ratio of two positive numbers so we cannot experience a profit factor less than 0. Additionally, any profit factor from 0 to 1 is not a profitable strategy with losses exceeding gains.
Sharpe Ratio
developed by Nobel laureate William F. Sharpe is a metric showing the ratio of average return compared to the drawdown. More simply, the average annual return divided by the standard deviation of the return. There are arguments for Sortino Ratio which does not penalize “upside volatility” as Sharpe does, but this guide is not the place for a deeper dive.
The pitfalls of algorithmic trading strategies
I need to share the common pitfalls of strategy testing. Later in this guide I will link to a more exhaustive list of tests we can use to improve our probabilities of success, sidestepping these below landmines.
Poor data
missing data can materially impact your results. Assume you had missing data from 2007-2008. Not good.
Look ahead bias
mixing data sets such as intermarket data or multiple timeframes brings a possibility you incorporate unknowable future information. For example, we cannot use the day’s closing price to make a trade at 12 noon as the day’s close is not yet known.
Survivorship bias
many data providers only provide actively listed stocks. We need to include stocks that delisted, went bankrupt, merged, went private, etc. Without these symbols then our backtest may be more favorable than it should be.

Favorable conditions
maybe you tested in a bull market, and any strategy would have done well. Test on all market conditions and environments! I wrote about ways to combat this here: Randomized Out of Sample Testing
Real market environment
can be impossible to know the historical liquidity and some software will allow you to buy more shares than the total volume. This could not happen in real market environment without drastically affecting the share price.
Underfitting
an algo that is too simple will “underfit” the market’s past data. This means it will not capture any unique price anomalies in the future.
Overfitting
an algo that is too complex will “overfit” the data capturing noise and mistake it for unique price anomalies in the future. Over optimizing parameters or having too many rules are the most common culprits of overfitting. Overfitting is often referred to as curve fitting in finance. Curve-fit strategies fail as the market changes and trust me it changes.

Robustness Tests for Algorithmic Trading Strategies
A robust trading strategy can stand the test of time and changing market conditions. Quantitative trading firms employ a litany of statistical tests, stress tests, and robustness checks to attempt to find good fit and robust systems. In this section, I will introduce useful concepts from my professional trading experience and a decade-plus of primary research into the topic of trading strategy robustness.

Robustness testing is a vast area, but if done well, can be a trading edge over other market participants because many fall short here. This is by no means an exhaustive list but can surely increase the probabilities of algorithmic success.
To read more about robustness testing for algorithmic trading please check out my full guide: Robustness Testing for Algorithmic Trading Strategies
In sample and Out of Sample Testing for Algorithmic Trading Strategies
The first line of defense against overfitting is to split the historical data into two segments: the in-sample data and the out-of-sample data. The split can be placed anywhere but traditionally most traders use 70% of the data as in-sample and the last 30% of the data as out-of-sample.
To learn about intelligently splitting the data, please check out:
- Out of Sample Data – How the Human Can Add Value
- Out of Sample Testing Guide
- Randomized Out of Sample Testing
We build our algorithmic trading strategy on the in-sample data leaving the out-of-sample data untouched. Once happy with our strategy’s performance, we then test the strategy on the unseen, untouched out-of-sample data.
If the strategy performs well on the out-of-sample data, then we should have heightened confidence our strategy should do well on other unseen data.

Additional Robustness Checks for Automated Trading System
Vs Random
Is this a good strategy or was it pure luck? This test was discussed by Jaffray Woodriff of Quantitative Investment Management in the aforementioned Hedge Fund Market Wizards (Schwager, 2012).
The test creates the best possible random strategy to use as the benchmark to beat. The best possible random strategy is the best possible by chance (random). If we beat the best random strategy’s performance, then it is more likely real edge and not something lucky.
Build Alpha runs this every simulation. Below shows a real strategy vs. the best random strategies possible.

Vs Others
Does the strategy work on other markets? A SPY strategy that fails on other market ETFs such as QQQ, DIA, or IWM is likely overfit to the noise specific to the historical S&P500 data and will fail when noise changes. Strong performance across related markets is a strong sign of robustness.

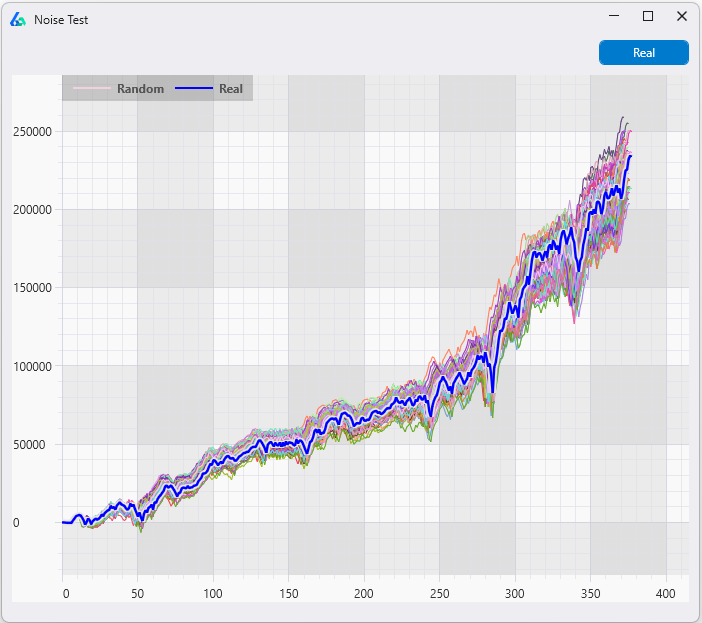
Vs Shifted and Vs Noise
Markets like oil and corn have natural consumers whereas this is untrue in stocks. Testing across other markets may not make sense in these markets. The fix? Shift or add noise to the original data then re-trade the strategy on the shift or noise-adjusted data.

If the algo remains profitable on the adjusted data, then we get a confidence boost we did not overfit to the historical noise and the strategy can survive future noise variations.
If the noise test shows losing strategies, then we have overfit to the historical data. To read more about the noise test check these out:
These quick explanations skip nuances and certain tests were left out. Please read the comprehensive Robust Trading Strategy Guide to learn about other tests such as: variance testing, delayed testing, liquidity testing, and more.
Trading Algorithm Position Sizing. Can a computer size my trades?
There are a handful of popular position sizing methods used by algo traders. All these methods could be coded or generated from Build Alpha to apply to any strategy. In this section, let’s break down a few of the most popular sizing methods:
Fixed Size
taking the same size position every trade, i.e., 100 shares or maybe 1 futures contract or 1 forex lot. The algorithm would continue to buy and sell 100 shares regardless of price movement.
Fixed Dollar
the trader sets a dollar amount per trade and then the algorithm would buy that dollar amount of shares each trade. As the share price rises, the computer would purchase less shares. As the share price falls, the computer would purchase more shares. It is important to note that the share amount is calculated prior to each entry and unchanged while in a position.
Volatility Based
the computer will size the position based on the symbol’s volatility (typically Average True Range). As volatility rises, the computer will trade smaller positions. As volatility falls, the computer will trade larger positions. It is natural to reduce position sizes as risk (volatility) increases.
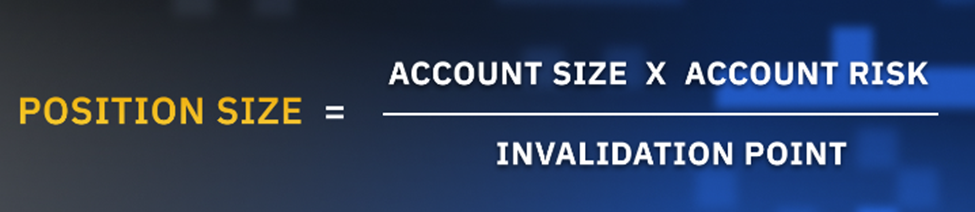
Risk Percentage
this method can only be used when the strategy uses a stop loss. The trader determines an amount he is willing to lose per trade. The computer will determine the distance between the entry and stop loss and then size the position so that the max loss is the amount the trader is willing to lose. This aggressive style does not account for when you cannot exit at your stop loss (gaps, illiquidity, missed orders, etc.). Some losses can exceed the amount a trader is willing to lose.
Do I have enough capital for this automated trading system?
One of the largest and most common pitfalls traders make is not setting aside enough capital for their strategy algo. Many traders will look at the historical backtest’s maximum loss or the maximum drawdown and determine this as the amount of capital needed to trade the strategy.
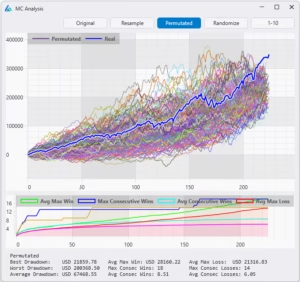
Build Alpha offers a variety of Monte Carlo tests that can quickly aid traders in understanding how flawed the above sizing logic is. Let’s work from an example that had a worst trade maximum loss of $816.88 and a maximum drawdown of $981.38.

Running the Monte Carlo Analysis, we easily see that the average drawdown from the Monte Carlo variations was about $1,500 or 1.5x the original backtest’s drawdown. Not using the Monte Carlo Analysis tool could lead to undercapitalizing the strategy causing a premature plug pull and abandoning ship too soon.

However, there is a better approach to find the correct allocation to any trading strategy or portfolio, the Monte Carlo Drawdown method which was popularized in Howard Bandy’s book Quantitative Technical Analysis.
Funding an algorithmic trading system with Monte Carlo Drawdown Analysis
To run the Monte Carlo Drawdown analysis, the trader selects a percentage drawdown he could stomach and a starting trading account size. Most traders cannot withstand a 20% drawdown.
Next, run 1,000+ Monte Carlo tests resampling from the historical trades to create 1,000+ new equity curves (can reshuffle the trade order as well). Then calculate the drawdown of each new equity curve and plot the 1,000+ drawdowns as a histogram. Finally, plot a cumulative distribution line on top of the histogram (in blue below). This line plots the total percentage of drawdowns as we move from left to right across the horizontal x-axis.

Tracking up the Y-axis to see where 95% intersects with the blue cumulative distribution line. This spot indicates 95% of all Monte Carlo drawdowns were less than this. Connecting this red X to the x-axis shows the drawdown of 30%.
We can say, “we are 95% confident drawdowns from this trading system will not exceed 30%”.
This value is unacceptable to most. We should strive for a drawdown less than 20%. Meaning, the starting trading account value is too small to trade this strategy and we could easily see a drawdown greater than our pre-determined 20%.
If we increase the account size and run the test again, we can see the 95% confidence spot (red X) is now at slightly less than a 20% drawdown on the x-axis.

Sizing strategies – and portfolios – properly is one of the easiest ways to ease the emotions of drawdowns. It also makes sticking to a system long enough to escape randomness more doable in turbulent markets.
Read more on this technique and see a strategy example please head here: Properly Funding Strategies with Monte Carlo Drawdowns
Identify Broken (failing) Algorithmic Trading Strategies
To define failing, we must first define passing behavior. Monte Carlo testing once again gives us a guideline. Important to note that other more advanced tests such as noise testing, Vs shifted, Monte Carlo permutation, and Variance testing could also apply. Monte Carlo results give us a cone of what is possible at trade number X.
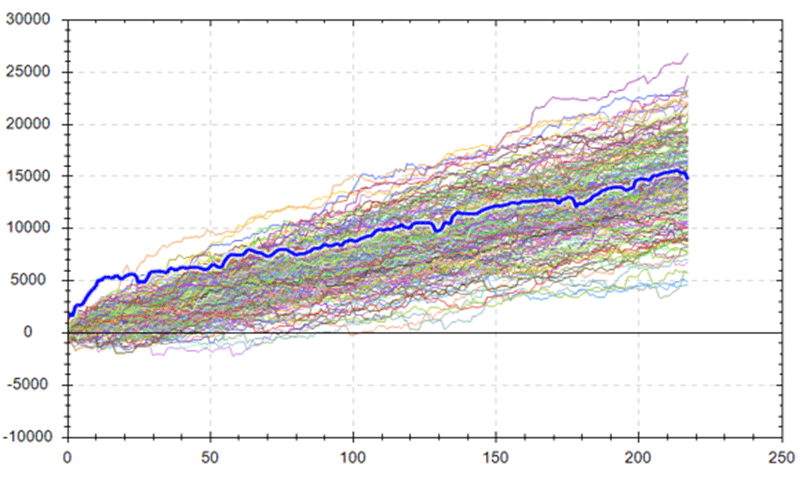
In the graph above, we can see that after 100 trades the strategy’s P&L should be anywhere from $0 to $15,000. This is a large range but gives an idea of what our expectations should be at trade 100.
If at trade 100 the P&L is between $0 and $3,000 then we certainly had some bad luck, but the strategy is not broken! The strategy is just in the lower range of what was possible (bad luck). On the other hand, if the strategy’s P&L at trade 100 is between $12,000 and $15,000 then we had tremendous luck. This success was possible despite not being a conservative estimate at trade 0.
If we are at trade 100 and the P&L is less than $0 or greater than $15,000 then we are outside expectations. This is the first sign things are broken (not going as expected).
Build Alpha has a tool that generates Monte Carlo bands from the last trade and plots forward as many trades as desired. It is best practice to only trade strategies that have a flat or upward sloping lower band.

If performance is falling outside the red Monte Carlo bands, then it is best to do at least one of the following:
- Analyze what has changed in the market
- Analyze what has changed in the strategy
- Reduce your strategy’s position size
- Take your strategy offline
To read more on Monte Carlo Simulation and applications to algorithmic trading please check out: Monte Carlo Simulation Complete Guide
Algorithmic trading success needs the portfolio approach
The perfect strategy or “holy grail” hunt is often the worst adventure one can embark upon. I lived this for many difficult years chasing chat rooms, magic indicators, and more to hopefully learn that the one missing piece. Turns out there is no one missing piece.
The holy grail is combining uncorrelated strategies to smooth returns. Ray Dalio of Bridgewater, the largest hedge fund in the world, shared a graphic in his book Principles showing the math behind the true holy grail: adding uncorrelated strategies together.

On the right-hand side, the more uncorrelated strategies you combine the lower your probability of losing money. Lightbulb moment. I don’t need a perfect strategy; I need a bunch of good strategies working in concert.
Michael Jordan needed someone to do the dirty work: play aggressive defense, check defenders down low, grab rebounds, make hustle plays. He did not need someone else to score points. Your portfolio needs a team mentality. Some players are not great on their own (cough Rodman), but on a team, they fill a role making everyone exponentially better.
That’s right, some strategies may not be profitable but still additive to your portfolio! Certain strategies do well in certain markets while other strategies do well in other market conditions (aka doing the dirty work the core strategies cannot).

In the graphic above, strategies A and B are the best standalone strategies as strategy C has a negative return! However, when combined (and scaled to the same volatility), A+C do much better than A+B. When A yins, C yangs. Conversely, A and B ebb and flow at the same time (two scorers). A+C provide an awesome example to the team, or portfolio, approach Dalio mentioned.
There is more to be gained understanding this than hunting the perfect strategy.
Key Takeaways
- Algorithmic trading volume is rapidly growing
- Algo trading is used by the largest banks and best hedge funds
- Algorithmic trading is possible for all asset classes: stocks, futures, mutual funds, forex and crypto
- TradeStation and NinjaTrader are the best data providers and brokers
- Python and C++ are popular programming languages for algorithmic trading
- Build Alpha software enables traders to build algo strategies without writing any code
- A portfolio of algos is better than hunting a single perfect “holy grail” strategy
Need to Know
- Algo trading is when a computer executes pre-determined buy and sell rules for you
- Algo trading does not require programming. Build Alpha is a no-code strategy builder
- Hedge fund and professional software and testing is now available to all algo traders
- Finding robust strategies requires additional testing after backtesting
- Monte Carlo Drawdown technique can help size automated trading strategies correctly
- Portfolio approach to algo trading is the “holy grail”
Summary of the Complete Algorithmic Trading Guide
Automated trading systems are the fastest growing portion of the market comprising nearly 75% of the daily volume according to the previously mentioned 2018 study. The 12 largest banks and top hedge funds, including the best hedge fund of all time Renaissance Technologies, all utilize algorithms and automated trading.
The data and tools to build your own algorithmic trading strategy have never been more accessible or even available to individual traders as they are today. Build Alpha is an all-in-one, start to finish algorithmic trading strategy development tool that enables traders to follow the steps laid out in this guide without having to write any code.
I am on a mission to develop Build Alpha as the best automated trading software. Please take the ten minutes to check out the demo and see how it can help any level of trader save time, reduce uncertainty, and hopefully gain an edge in algorithmic trading. If you have any questions, please email me anytime. For more on Algorithmic Trading please check out FINRA the Financial Industry Regulatory Authority.
Author

David Bergstrom – the guy behind Build Alpha. I have spent a decade-plus in the professional trading world working as a market maker and quantitative strategy developer at a high frequency trading firm with a Chicago Mercantile Exchange (CME) seat, consulting for Hedge Funds, Commodity Trading Advisors (CTAs), Family Offices and Registered Investment Advisors (RIAs). I am a self-taught programmer utilizing C++, C# and python with a statistics background specializing in data science, machine learning and trading strategy development. I have been featured on Chatwithtraders.com, Bettersystemtrader.com, Desiretotrade.com, Quantocracy, Traderlife.com, Seeitmarket.com, Benzinga, TradeStation, NinjaTrader and more. Most of my experience has led me to a series of repeatable processes to find, create, test and implement algorithmic trading ideas in a robust manner. Build Alpha is the culmination of this process from start to finish. Please reach out to me directly at any time.