What is Backtesting?
Backtesting is applying a trading strategy on historical market data to view how a particular strategy would have performed in the past. A backtest will return the hypothetical total profit, a list of historical trades, and many other performance metrics to analyze a trading system’s potential viability in financial markets.
For example, we can take the past ten years of data and apply our strategy – in hindsight – to view how the strategy would have performed over these past ten years. The backtest’s results can help drive trading decisions such as:
- discard the trading strategy
- tweak the strategy
- investigate the strategy further
- move the strategy to a demo account for monitoring
What is Backtesting Used For?
Backtesting gives traders and investors a sense of a strategy’s profitability on historical data which may give insights into how the strategy can be expected to perform in the future.
However, please note, all disclaimers in financial markets will warn that historical performance is not indicative of future performance. However, seeing positive past performance can grant a trader confidence.
In short, backtesting is testing trading opportunities on historical data to assess the historical profitability of a trading strategy or market environment.
Backtesting can be used to check the viability of a single trading system, gain a better understanding of how a strategy would perform during certain market environments, or to compare competing trading signals when capital may be limited.
Why is Backtesting Important?
Backtesting provides a way to analyze risk prior to risking real capital. The immediate insights a backtest provides can potentially save the trader money by helping him avoid a potential losing strategy.
If a trading strategy performs poorly, losing money during a backtest, then there should be less incentive to live trade the strategy with real capital as it may result in losing money rapidly.
On the other hand, a good backtest should be a requirement for risking capital. This does not mean that a good backtest is a greenlight to bet the farm, but a trader should desire to see a profitable backtest before committing real capital.
Backtesting provides important performance statistics of a potential trading strategy such as:
- potential profit and loss
- potential drawdowns
- total trades
- winning percentage
- risk/reward
- largest winning trade
- largest losing trade
- consecutive winning streaks
- consecutive losing streaks
All these insights can better help prepare the trader for live trading the strategy, the risks involved, gain confidence, or choosing between two competing strategies which all help contribute to long-term success.
What do you need for Backtesting a Trading Strategy?
There are only two things you need to conduct a proper backtest:
- Historical Price Data for desired time period for the test
- Trading Idea (or Idea Generator)
These two points are enough to conduct manual backtesting where you can replay the charts, view where you would have entered, and track your strategy on paper or with virtual money. This is often enough for testing purposes before you start trading. A bit more on these two points below.
Historical Data Needed for Backtesting
What kind of Data is needed for backtesting?
The most important element for running a backtest is historical financial data. Financial data normally comes as a time series in OHLC or open, high, low, close format. Below is an example of historical SPY data.

Resources for Free Financial Data
- Dukascopy.com Historical Data Export
- Nasdaq Price Data AAPL Historical Data
How much data is needed for backtesting
The goal is to get enough trades from the backtest to feel confident the trades were not lucky and perhaps find an effective trading strategy.
For example, if you flip a coin 10 times and get seven heads then we cannot determine if the coin is rigged. However, if we flip the coin 10,000 times and get 7,000 heads then we can be sure the coin is rigged.
This is because as the sample size increases, we should converge toward the expected value. This mathematical concept is known as the Law of Large Numbers. I give a full breakdown in my Robust Trading Strategies Guide.
We really want to see at least 100 trades or more to avoid “luck” playing a role. Note this is a rule of thumb and not a steadfast number. If our strategy trades once per month then we would need 100 months of data or roughly eight years. However, if our strategy trades more frequently then you can backtest with smaller data histories.
Bull and Bear Data
There are many other considerations such as all data coming from a bull market or should data be from both a bull and bear market, etc.? However, these advanced questions are answered in the above-mentioned guide.
For now, we need enough data to generate enough trades. This should be your only concern.
Backtesting different time periods and market conditions
It is wise to include different time periods or market environments in your backtest. For example, a long breakout strategy may do well in a bull market and poorly in a bear market. If your backtest only contains historical data during a bull market, we may be deceived into believing we have found a holy grail. Does it work on another time period?
Backtesting different markets
Do you need stock market data if you are testing a forex strategy? A forex trading strategy may only require currency pair data and fx traders may have no need for stock or future data. Trading cfds and futures or stocks may require different data sets or time periods but a strategy that backtests well across different markets can be a reliable indicator to future results. Quantitative strategies that perform well across financial instruments, showing similar performance on various symbols, can be a key component to success.
Finding Trading Ideas for Backtesting
If you have been around the markets long enough, you will begin to create your own trading ideas but there are various other ways to quickly stumble upon trading ideas to backtest. Below are some basic steps to sourcing new trading ideas.
Screen Time
The more time you spend watching live market charts and order books the more patterns you will identify. These patterns are great ideas to test for viable trading strategies.
Trading Books
Most naïve traders make false claims about trading books, “if this was profitable why would the author write about it”? In reality, there are many great trading books and ideas out there.
Trading Papers
Brilliant researchers publish white papers and research papers that leave hints, ideas, trading methods, and further areas to research. Arxiv.org is a great resource and even has a quantitative finance filter.
Technical Indicators
Viewing technical analysis indicators can give insights into how other traders are looking to summarize trading concepts. These can be incorporated into your own strategies and backtests.
Alternative Data
Using alternative data can help add context to price action signals or provide new trading ideas. For example, companies that have many job openings and listings may be expanding quickly!
Genetic Algorithm or Machine Learning
A genetic algorithm takes massive amounts of inputs and attempts to mix and match to find the best possible combinations (crude simplification). In theory, it is generating new ideas for you. This is the core behind Build Alpha no code algo trading software which I will describe later.
Machine learning works in much the same way and can also be thought of as a way to create new trading ideas or a predictive model.
Backtesting Programming Language or Software
To apply our trading idea on the historical data to complete our backtest we need some type of programming language or software. Below are the best options for both new and advanced backtesters.
Backtesting in Excel
Microsoft excel is excellent for quick and easy backtesting. I wrote a full example here: Backtesting in Excel. In short, here is a quick example on SPY that buys when price closes in the bottom 20% of the day’s range and sells the next day.

Backtesting with Python
Python is the fastest growing programming language due to its easy to learn syntax and easy to read coding style. Python has many various libraries (publicly available code) you can incorporate into your own code to create technical indicators, run scenario analysis, backtest and more. Here are a few favorites:
- Technical Analysis Library: TA-Lib (mrjbq7.github.io)
- Zipline Backtesting Framework: Backtesting — Zipline Trader 1.6.0 documentation (zipline-trader.readthedocs.io)
- Some tips for Backtesting in Python: Create Trading Algo in Python
Backtesting with C++
C++ is much faster than python and primarily used by high frequency traders to backtest terabytes of tick data and more. However, C++ is much more complex to learn and harder to read. If you are new to programming this language has a steep learning curve but is worth it once mastered.
No Code Backtesting Software
For those that do not want to be limited by excel or learn a programming language then I would highly recommend Build Alpha as backtesting software. Manual backtesting can be a time-consuming process. With a little computing power, Build Alpha’s automated backtesting engine can test hundreds of thousands of strategies per second.

Build Alpha also has 6,000+ built-in entry and exit signals, the ability to create your own signals, and advaned robustness tests to identify lying backtests.
The best part is Build Alpha is completely code free and requires no programming! I will share more on Build Alpha below.
Backtesting Trading Strategies Example
Let’s backtest a trading strategy. Actually, let’s backtest three simple trading ideas so we can see the results, what a sample trade looks like, and more.
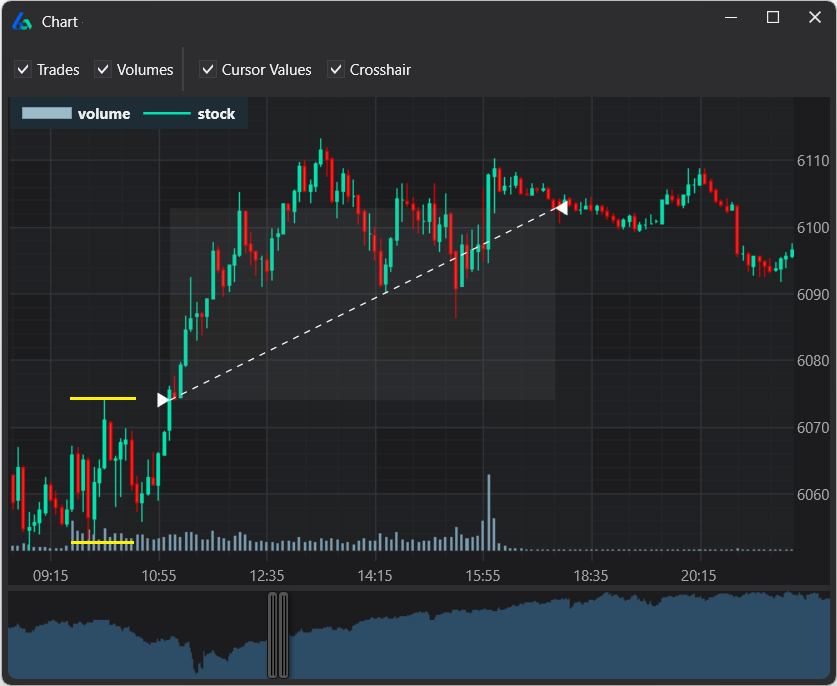
First, let’s backtest a moving average crossover. Let’s buy when the 5-period simple moving average (SMA) crosses above the 10-period SMA. We will sell when the 5-period SMA crosses below the 10-period SMA. Here is a simple image of the entry and exit signal.

Below is a sample equity curve applying this strategy to SPY historical data over the time period 2008 to 2022. Obviously not confidence inspiring.

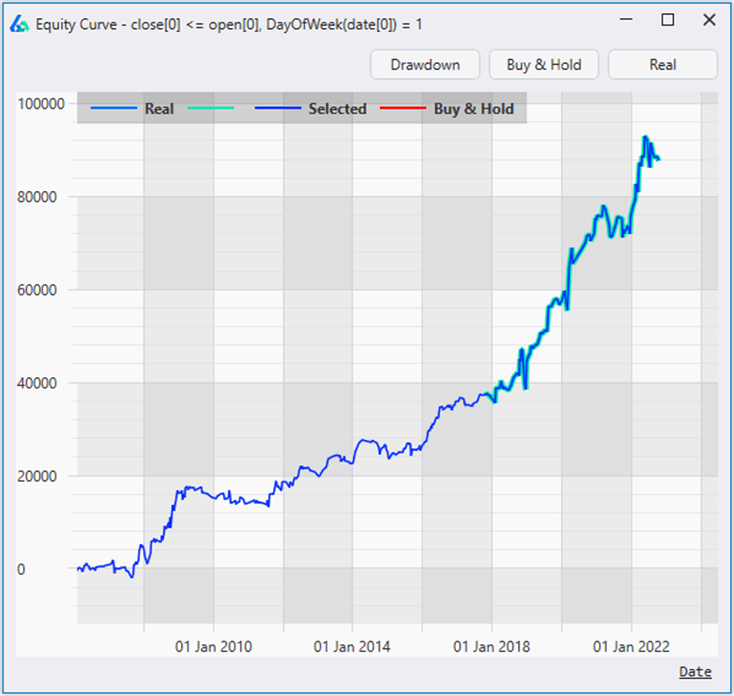
The second strategy will buy SP500 futures e-mini contract after a negative Monday and hold for one day. This strategy is known as “Turnaround Tuesday” which I originally wrote about in 2017. Let’s check performance since then using Build Alpha automated software to backtest a trading strategy.
Finally, let’s buy SPY after a bearish engulfing candle and hold for one day. This strategy was originally published in 2017 where I exposed some market “truths” that could be debunked with backtesting. Let’s check performance to see if it has maintained its stellar win percentage. Spoiler: it has with a 62%-win rate since 2017 following a “bearish” engulfing candle.

Analyzing Backtest Performance
In the above examples we viewed different metrics. In the first two, we viewed total profit via the equity curve, and in the third example we viewed winning percentage.
What are the best backtest performance metrics and how can we compare trading strategies after viewing backtesting results?
Main backtest performance metrics
- Total Profit – total money gained or lost during the backtest
- Equity Curve – cumulative profit graph of all historical trades, trade-by-trade
- Maximum Drawdown – the worst peak to trough drop in total profit during the backtest
- Average Trade – typical gain or loss per trade
- Winning Percentage – total number of winning trades divided by total trades
- Total Trades – total number of trades taken during the backtest
- Profit Factor – total dollars earned divided by absolute value of total dollars lost
- Sharpe Ratio – a risk-adjusted return metric created by Nobel laureate, William F. Sharpe
Calculating Sharpe Ratio
According to Investopedia, Sharpe ratio is a measure of risk-adjusted return and describes how much excess return you receive for the volatility of holding the riskier asset. It is calculated as the return minus the risk-free rate divided by the standard deviation to achieve that return. The higher the Sharpe ratio the better. Risk-adjust returns are a great way to compare strategies.
Sharpe Ratio Calculator
Below is a free Sharpe Ratio calculator where you can enter your backtest’s return percentage and standard deviation to calculate your Sharpe Ratio. Play around and see how return and volatility coexist.
Backtesting Benefits
There are five major benefits to backtesting a given strategy. Below I cover each one.
1. Helps avoid bad strategies
Backtesting a strategy before risking capital can help avoid losing strategies that stand zero chance to make a profit and will perform poorly in live trading.
2. Paper trading
Backtesting can help a trader visualize what following a trading strategy would be like. Finding a strategy that matches your personality can be a benefit to long-term success. Utilizing a risk-free demo account to conduct paper trading to gain confidence is an excellent idea before risking money.
3. Evaluate different market conditions
Backtesting enables traders to analyze a strategy on different market conditions from different historical data periods. How does this strategy do during the 2008 Great Financial Crisis? How does it do during a strong bull run from 2013 to 2015? How did it do during the Covid drop of 2020 or some future market conditions we do not know yet?
Additionally, intraday strategies can be evaluated on different days of the week or during different time windows.
4. Set proper expectations
Backtest results can help traders understand how profit and loss expectations should be set and engage in smarter money management. If a strategy earned $10,000 per 100 shares per year, then expecting a strategy to make $1,000,000 on 100 shares next year would be unreasonable investment research.
Moreover, noticing a steep drawdown during a backtest can help a trader properly fund a strategy prior to going live.
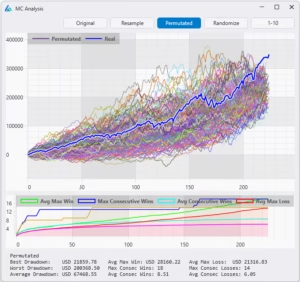
I spoke more about setting proper expectations here: Monte Carlo Analysis and Drawdowns
5. Compare Strategies
Not all traders have unlimited capital and must choose between strategies. Backtests can help traders understand where and when their capital is best put to use. Spread bets, algo trading, futures, stock gappers, trading cfds, etc. can all be compared objectively.
Backtesting Pitfalls and Common Mistakes
Poor backtest results often indicate a strategy unworthy of live trading. However, good backtest results are not a greenlight to live trade. There are a handful of backtesting pitfalls we must watch. Some backtests may be too good to be true!
Overfitting or Curve Fitting Backtesting Risk
Over optimization or curve fitting is finding a trading strategy that too closely fits the historical data and will fail to adapt to new data. The strategy essentially learns the nuances of the historical data during the backtest but fails on new data when the exact nuances do not play out exactly as they did in the previous time period.

Overfitting is the largest risk system traders face. Overoptimizing parameters to improve backtest results can lead to great test results and good emotions, but horrible live trading performance.
There are many advanced techniques to overcome this pitfall which I wrote about here: Curve Fitting – Build Alpha
Look Ahead Bias
Another backtesting pitfall, look ahead bias, is using data that was not known at the time of the historical trade. A tragic example of look ahead bias in a multi-timeframe strategy would be using the daily close to make a trading decision midday. At the time of the trade, midday, it is impossible to know the close of the same day.
These look ahead bias risks are often negated and removed with proper data cleaning or professional grade automated backtesting software.
Survivorship Bias
Running a backtest on only currently traded symbols introduces too much optimism in the backtest results as it can avoid buying stocks that eventually went bankrupt or delisted. This phenomenon is known as survivorship bias.
Much like look ahead bias, survivorship bias deals with underlying historical data issues. Many data providers only have symbols currently listed on exchanges. A proper backtest should consider all symbols that were available at all historical dates and times. This includes stocks that went bankrupt, merged, went private or delisted.

Additionally, choosing to run a backtest on only the best stocks also introduces survivorship bias. The best stocks cannot be known ahead of time and undoubtedly leads to overly optimistic results. If we could identify AAPL or GOOGL ten years ago then your personal finance situation would be significantly different.
We must be unbiased in our symbol universe selection to have truly reliable backtest results. Ask your data provider if they provide listed and delisted securities!
Ignoring Transaction Costs
Backtesting a trading strategy without transaction costs such as slippage or commissions can mislead traders into believing unrealistic backtesting results thus depleting their accounts in live trading.
Backtest results can show an average trade of $10 or $15 but in real markets where slippage and commissions are present the average trade may be negative.
Ignoring trading costs during backtesting can find unrealistic and unobtainable results. Always include transaction costs in your backtests for reliable results!
Backtesting vs. Forward Testing
Forward testing is creating a trading strategy and allowing it to trade on live data on a paper or simulated account. Some forward test in a real account with small size. Many traders view forward testing as a necessary component of moving a strategy from the research stage to the live trading phase.
Backtesting is great for quickly identifying the viability of a trading strategy. Forward testing creates the same hypothetical results but on new data. Forward testing takes more time but is done on the most recent data.
There is no need for a trader to choose one or the other as both can have their place in a proper strategy pipeline; however, forward testing is often not necessary if statistical significance can be obtained during the backtesting phase and rigorous robustness testing is applied.
Backtesting Portfolio
In financial markets, backtesting single trading strategies is a tremendous achievement and necessary for trading system developers. However, backtesting a portfolio of strategies goes one step farther.
Ray Dalio, founder of Bridgewater – the world’s largest Hedge Fund, released a compelling graphic demonstrating the math behind combining multiple strategies together.

The graphic shows the more uncorrelated strategies one can combine, the lower the probability of losing money in a given year. Wow! This epiphany is a true key to algo trading success. I wrote about it here: Algorithmic Trading Complete Guide.
That being said, it is important to have the ability or software to backtest portfolios of strategies not just single strategies. This was a key driver behind Build Alpha’s Portfolio Mode upgrade.
Advanced Backtesting Techniques
Due to the various pitfalls and brilliant minds in quantitative finance, various advanced techniques have been created to identify more reliable backtest results which hopefully lead to more sustainable live trading performance.
Out of Sample Testing (OOS)
Out of Sample testing is withholding some historical data for future testing – typically some percentage. First, develop and tweak your trading strategy on the In-Sample data. Once you have achieved desirable backtest results you can test your strategy on the withheld out of sample data.

Ideally, performance results should be similar in both the in-sample and out-of-sample data periods. If trading performance fails on the out of sample data, then we likely avoided an overfit or poor strategy.
I wrote more exclusively about this test here: Out of Sample Testing
Randomized Out of Sample Testing
Selecting the proper out of sample period is a challenge to creating reliable backtest results. What if you select an out of sample period that contains only a bull market (like the image above)? The out of sample test may be easy to pass. Randomized out of sample testing can help avoid this.
Randomized Out of Sample testing randomly selects non-congruent dates from your historical data set to be part of the out of sample period.

The trader can create 1,000 or more randomized out of sample periods then compare results on all of them. This helps overcome randomly selecting data points from a bull market only. Learn more about Randomized Out of Sample.
Lying Backtests. Are backtests enough?
Let’s discuss a simple case study that uses intermarket signals from the Japanese Yen to trade US 30-year bond futures. The strategy has only 2 rules for entry and produces fairly stable in-sample returns for being so simple (2003-2012 backtesting period).

Graph shown shows results based trading 1 contract per signal for demonstration purposes
The intermarket strategy performed quite well on the unseen, out of sample data (2012-2016 OOS). The ability for a strategy to continue to perform on unseen data is paramount and mission critical for many system traders and strategy architects.

Graph shown shows results based on 1 contract per signal for demonstration purposes
However, can we trust this backtest? In Build Alpha, there are many validation and robustness tests that can add confidence to your system development and backtesting process.
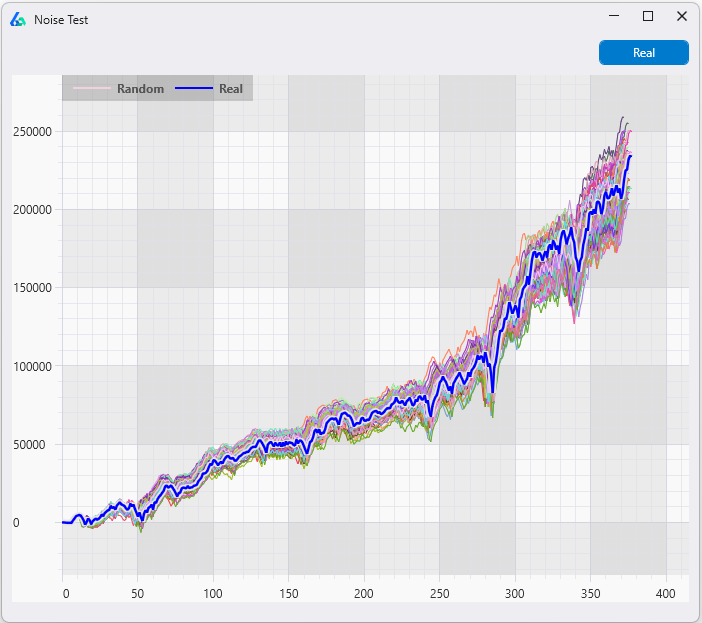
There is a special test called the “Noise Test” which creates 1,000 new price series by adding and subtracting varying amounts of noise (read volatility) from the historical data. The test then “re-trades” the strategy on the new 1,000 price series.
The idea is that if a strategy is overfit then it is overfit to the noise of the original data and is not trading the underlying signal we hope it is. Changing the noise will reduce performance if the strategy is overfit to the noise of the original data. Ideally, we want to see a strategy continue to perform well on the new, noise-adjusted price series.

This “Noise Test” can help prevent a backtest from lying to us and hopefully prevent us from wasting further research time or taking a weak strategy live! You can see that our original backtest in blue is significantly better than the 1,000 “Noise Test” results. This is worrisome and most likely a sign of an overfit strategy aka a lying backtest that will surely fail on live data.
Viewing this simple strategy’s performance since 2016 confirms the value of the Noise Test. The strategy has been in a nosedive since going “live”, but a smart trader would have never taken it live – no matter how pretty the backtest – due to the failed Noise Test.

Any kind of trading – manual or discretionary – should be subjected to these rigorous tests before getting real money allocations. If not, you may be in for a surprise from a lying backtest or unreproducible hypothetical returns!
To read the full article, please check out The Noise Test and Lying Backtests; additionally, I wrote about the Noise Test here: Noise Testing
Best Backtesting Software
Build Alpha is the best backtesting software available. To manually backtest trading strategies is a time consuming and error prone process. Build Alpha enables the trader to test any and all ideas in a few clicks and requires no coding or programming. Build Alpha also offers the most advanced validation and robustness tests to help identify lying backtests as this has been the focal point of my professional trading career.

Build Alpha’s genetic algorithm can take thousands of input signals, exit ideas, risk management rules, and more to find the best trading strategies for you. The robustness checks and tests give the ability to analyze any backtest result in depth before risking real capital. Portfolio mode allows for traders to combine strategies and backtest portfolios. To learn more head over to the Build Alpha homepage or sign up to see the demo.
Backtesting Need to Knows
- Backtesting applies a trading strategy on historical data to view hypothetical results
- Need data, a trading idea, software or coding to implement a backtest
- Can backtest all financial instruments, any time period, any market condition
- Use to identify poor strategies ahead of risking capital. A fast way of paper trading
- Backtesting performance metrics can compare strategies or run scenario analysis
- Positive backtest results are not a greenlight to trade a strategy; more testing required
- Build Alpha makes automated backtesting and validation possible with no coding
Summary
Many traders implement trading strategies without testing them which often leads to depleted retail investor accounts. Backtesting enables traders to visualize historical performance of any trading strategy prior to risking real capital. Traders only need market data and a trading idea to conduct a proper backtest. A backtest can be used to weed out poor strategies, identify those worthy of future research, compare competing strategies, and more. Backtesting is a vital tool in any serious trader’s repertoire but is not a be all, end all to print money. Backtesting is a great first step, but other validation methods are needed before one should risk real capital.
Author