Randomized Monte Carlo Strategy Analysis
In this Free Friday, I want to introduce a new feature to Build Alpha: The Randomized Monte Carlo Test. The purpose of this test is to give us another robustness test or tool to identify potentially unreliable trading strategies or lying backtests.
As system traders, all we can do is improve the probabilities that the strategies we take live will succeed. Identifying lying backtests or misleading results can both save the trader money and headaches.
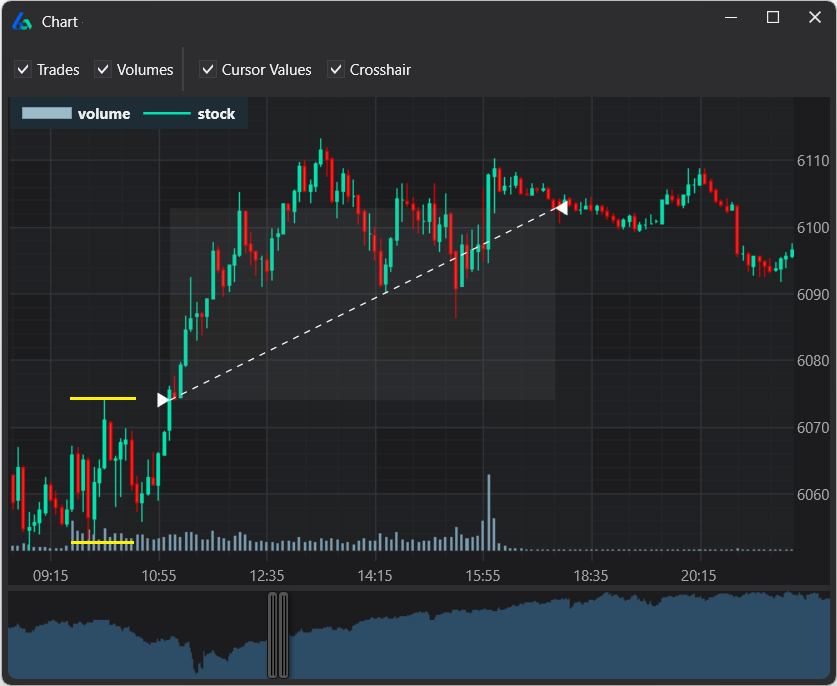
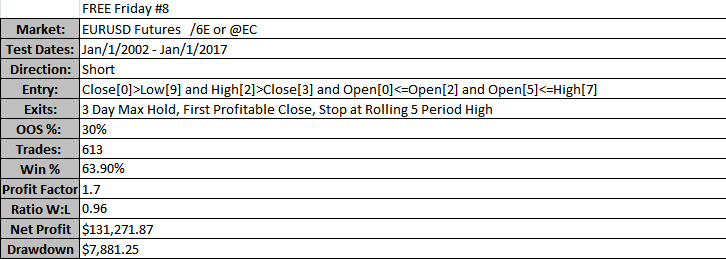
The strategy below shorts the EURUSD futures contract and has shown nice results on both in-sample and out-of-sample testing from 2002 to 2017 with a fairly large sample size of over 600 trades. Should we greenlight this strategy and trade it live?
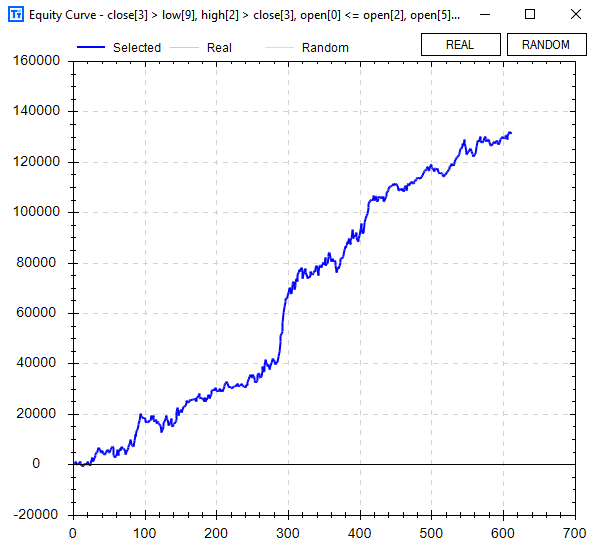
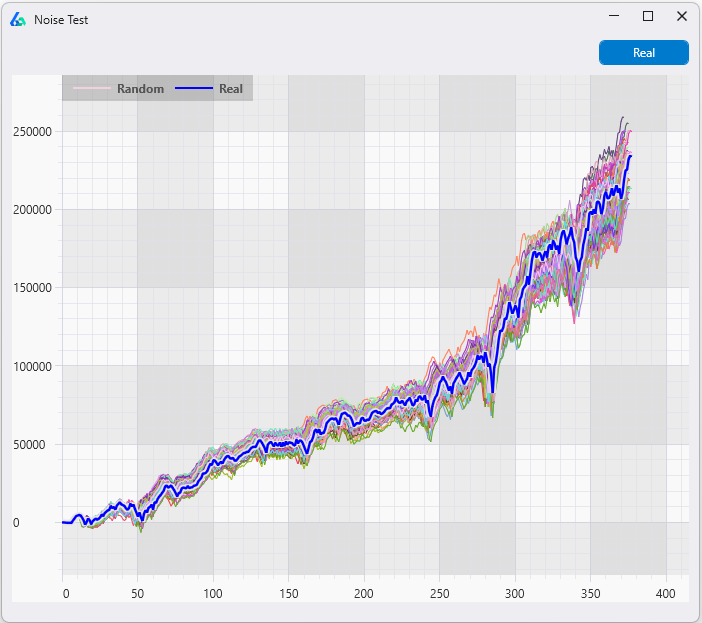
All performance metrics and even the simple reshuffle monte carlo method (pictured below) seems to give favorable insights to trading this strategy live. This strategy shows almost all Monte Carlo paths are profitable after 150 trades. Should we go live?

Let’s introduce one more test, the Randomized Monte Carlo test. This test can help us determine if this strategy’s backtest is lying to us and can potentially harm our account.
What is the Randomized Monte Carlo Test?
The Randomized Monte Carlo test re-trades the entry signal while modifying each trade’s exit at random (and within reason). The Randomized Monte Carlo test will not introduce new exit logic or remove any exit logic. That is, if the original strategy does not use a stop-loss then the Randomized Monte Carlo test will not introduce one. This is vital as altering the strategy’s logic can alter the underlying strategy to the point where the results do not tell us anything informative about the original strategy.
This particular strategy uses three unique exit strategies:
- Maximum 3-day hold || First profitable close || Stop at rolling 5-day high
In the Randomized Monte Carlo test, trade one will enter as expected but we may exit with a two-day max hold, first profitable close, or stop at the rolling four-day high.
The second trade will enter as expected but we may exit with a three-day max hold, second profitable close, or a stop at the rolling five day high.
Trade three will enter as expected but we may exit with a three-day max hold, first profitable close, or stop at the rolling seven day high.
This process will repeat for ALL the trades randomizing the exit each time. The first three hypothetical trades of the first run, that are stated above, are summarized below for simplicity and comparison’s sake. Again, this is random so you can imagine the variations possible.
- Maximum 2-day hold || First profitable close || Stop at rolling 5-day high
- Maximum 3-day hold || Second profitable close || Stop at rolling 5-day high
- Maximum 3-day hold || First profitable close || Stop at rolling 7-day high
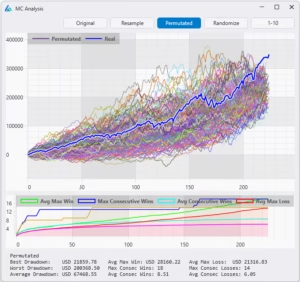
We then repeat this test and re-trade the strategy 1,000 or more times to make sure we have a reliable sample and remove any lucky “randomizations”. The results of this test on this Free Friday strategy are below. Yikes.

What does the Randomized Monte Carlo Test tell us?
In this particular example, this test and new feature in Build Alpha was able to identify a lying backtest and save us from implementing a false positive or “too good to be true” trading strategy.
The test is intended to validate we have not overfit our exit strategies/signals. If the Randomized Monte Carlo results are all positive, then it can tell us that our strategy’s entry has enough edge worth harvesting and could maintain profitability even with random exits. However, seeing struggling results like the graph above indicate a lying backtest and potentially overfit exits. This is just another tool in our trading toolbox to help prevent or reduce the risk of curve fitting.
For instance, strategies showing nice equity curves but poor edge ratios are always suspicious. The Randomized Monte Carlo test is a good candidate here and can identify overfit exits that are squeezing out profits when the edge ratio indicates there should not be much! Anyways, more to come in Build Alpha on strategy robustness and reliability.
Thanks for reading,
Dave
Read the Full Monte Carlo Simulation Guide (free equity curve simulator).