What is Market Breadth?
Market Breadth is a general term for any technical analysis indicator that attempts to quantify the strength or weakness of a stock market index by the aggregate participation among the index’s components. Market Breadth is an attempt to “look under the hood” of the stock market index to gauge the market’s health. A healthy market, in theory, should have sustained price trends.
Market Breadth indicators can be tremendous additions to trading systems that focus on price action. Price action alone may not provide the entire picture and market breadth can add this much needed context to trading systems.
Is this rally broad based and going to last or are investors flocking to a few safe haven names? Market Breadth can help influence trading system positioning and hopefully eradicate a few false positive signals.
Market Breadth Indicators
Build Alpha’s latest update includes market breadth indicators alongside the existing 5,000+ pre-built signals. In this article I will explain the main market breadth indicators, what they quantify, and how to add them to the
Build Alpha no code strategy engine (genetic algorithm).
- TRIN
- TICK
- NYSE Advance Decline Ratio
- Number of 52 Week Highs
- Number of 52 Week Lows
- Percent of SP500 Stocks Above SMA
- Percent of SP500 Stocks Below SMA
TRIN or Arms Index
TRIN is a short-term indicator that compares the number of advancing and declining stocks to the advancing and declining volume. Originally created by Richard W. Arms, Jr. with the intent of gauging volatility in the stock market, TRIN can provide insights into market strength.
In theory, a rising TRIN indicates a weak market while a falling TRIN indicates a strong market. A value below 1 is considered bullish and above 1 is bearish. However, please test EVERYTHING.
Calculating TRIN
TRIN = (Advancing Stocks / Declining Stocks) / (Advancing Volume / Declining Volume)
where:
- Advancing Stocks = number of stocks higher on the day
- Declining Stocks = number of stocks lower on the day
- Advancing Volume = Total volume of all advancing stocks
- Declining Volume = Total volume of all declining stocks
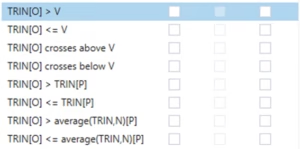
Using TRIN with Build Alpha
TRIN is in the Market Breadth signal category and can be directly searched. Typical TRIN readings range from 0 to +2 with extremes above 2.
Build Alpha built-in TRIN signals – all optimizable
- above or below a specific value
- crosses above or below a value
- above or below n-bars ago
- above or below a moving average
NYSE TICK Index
The TICK Index compares the number of stocks rising on the New York Stock Exchange with those that are falling. In this case, a rising stock is defined as a stock where liquidity is being removed; that is, trading on or above the offer. A falling stock is trading at the bid or below.
There are approximately 2,800 stocks listed on the NYSE and if 1,500 traded on the offer and 1,300 traded on the bid then the TICK reading would be +200 (1,500 – 1,300).
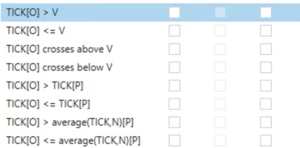
Using TICK with Build Alpha
TICK is in the Market Breadth signal category and is directly searchable. Typical values range from -1000 to +1000.
Build Alpha built-in TICK signals – all optimizable
- above or below a specific value
- crosses above or below a value
- above or below n-bars ago
- above or below a moving average
NYSE Advance Decline Difference
The AD Line or NYSE Advance/Decline Line is another breadth indicator calculated by taking the difference between the number of advancing and declining issues.
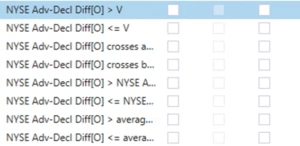
Using NYSE Adv/Dec with Build Alpha
NYSE Adv-Decl Diff is located in the Market Breadth signal category and directly searchable. Values range from -3,000 to +3,000.
Build Alpha built-in NYSE Adv-Decl Diff signals – all optimizable
- above or below a specific value
- crosses above or below a value
- above or below n-bars ago
- above or below a moving average
52 Week High Stocks and 52 Week Low Stocks
A count of S&P 500 stocks making new 52-week highs and a count of S&P 500 stocks making new 52-week lows is also available. This reading can show how widespread the market involvement is. A stock index making new highs without broad participation can indicate where or what market participants believe about the current rally.
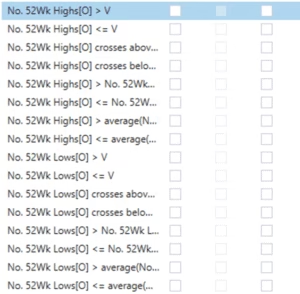
Using 52 Week Highs and 52 Week Lows with Build Alpha
No. 52Wk Highs and No. 52Wk Lows are in the Market Breadth category and directly searchable. Values range from 0 to 500; however, it is rare to see values north of 300 for either indicator.
An idea: Requiring one to be high and the other to be low may provide a different market regime as opposed to them both to be near each other in value. Different ways to quantify the market environment!
Build Alpha built-in No. 52Wk Highs and No. 52Wk Lows signals – all optimizable
- above or below a specific value
- crosses above or below a value
- above or below n-bars ago
- above or below a moving average
Percentage of SP500 Stocks above Simple Moving Average
Tracking the percentage of stocks above their respective moving average can serve as an overall health assessment. More stocks above their moving averages means less investors underwater and (theoretically) less pressure to sell.
On the other hand, if all or most stocks are below their moving average then there may be no sellers left and one can investigate market exhaustion (bottom) signals.
Using Percent of SP500 above or below SMA with Build Alpha
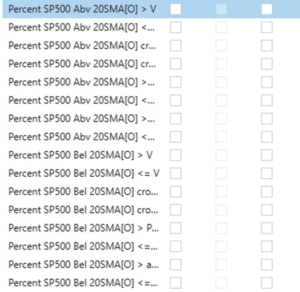
Percent SP500 Abv SMA signals are in the Market Breadth signal category and directly searchable. There are different signal groups for the 20-day, 50-day, and 200-day moving average. Since the values are a percentage, they range from 0 to 100.
Build Alpha built-in Percent SP500 Abv SMA and Percent SP500 Bel SMA signals – all optimizable
- above or below a specific value
- crosses above or below a value
- above or below n-bars ago
- above or below a moving average
Market Sentiment is the overall investor attitude or investor attention toward the anticipated future price movement of a particular security or market index. In short, it is a numeric representation of how investors feel about where the market is headed.
Market sentiment can range between extreme bearishness to extreme bullishness. How investors feel can be valuable information for how likely a certain price action signal or trading system may fare.
Kresimir Penavic, an applied mathematics PhD from Renaissance Technologies (the best hedge fund ever and founded by
Jim Simons) has a great quote in
The Man Who Solved the Market regarding sentiment:
“What you’re really modeling is human behavior”, explains Penavic, the researcher. ”Humans are most predictable in times of high stress – they act instinctively and panic. Our entire premise was that human actors will react the way humans did in the past….we learned to take advantage.”
Human sentiment, behavior and high stress seem valuable inputs to trading systems. What if you built one only when… anyways.
Sentiment Trading
Build Alpha’s latest update includes a handful of sentiment indicators that traders can test and include in trading systems. Let’s investigate a few below
AAII Investor Sentiment
The
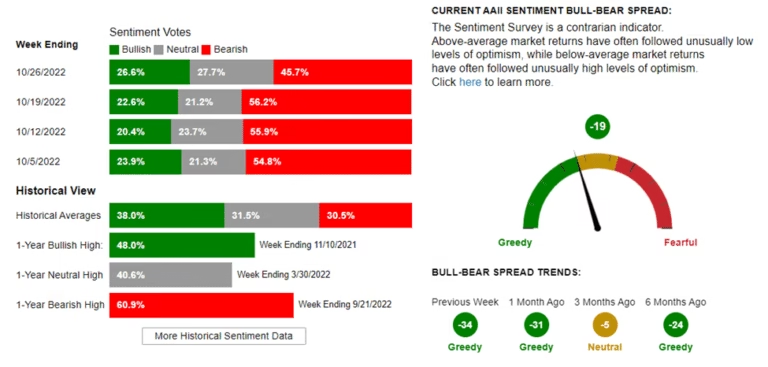
AAII Sentiment Survey asks individual investors their opinion on market direction six months out and has been doing so since 1987. The American Association of Individual Investors (AAII) survey participants and the returning votes are classified as bullish, neutral, or bearish. The survey is conducted weekly and is made available Thursday morning.
The website is very cool and provides a nice snapshot for the current week.
Using AAII Sentiment with Build Alpha
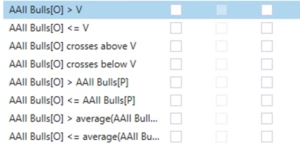
AAII Sentiment is found in the Market Breadth signal category and is directly searchable. The values range from extreme bearishness to extreme bullishness with a scale from 0 to 100. Build Alpha provides the bullish, neutral, and bearish values separately.
Build Alpha built-in AAII Sentiment signals – all optimizable
- above or below a specific value
- crosses above or below a value
- above or below n-bars ago
- above or below a moving average
NAAIM Exposure Index
The National Association of Active Investment Managers Exposure Index represents the average exposure to US equities reported by its members. The association states “the index provides insights into the actual adjustments active risk managers have made to client accounts over the past two weeks“. The index is updated on Thursday mornings.
The range of responses are
- 200% Leveraged Short
- 100% Fully Short
- 0% (100% cash or hedged to market neutral)
- 100% Fully Long
- 200% Leveraged Long
Then NAAIM returns the average of all responses as well as the deviation, both of which are available in Build Alpha.
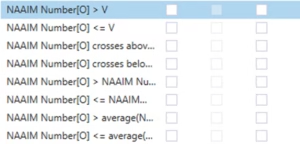
NAAIM Exposure Index is found in the Market Breadth signal category and is directly searchable. The values can range from -200 to 200.
Build Alpha built-in NAAIM Exposure Index signals – all optimizable
- above or below a specific value
- crosses above or below a value
- above or below n-bars ago
- above or below a moving average
Only the NAAIM number or average is shown above
Google Trends
Google Trends shows how frequent people are searching certain keywords. Build Alpha pulls data directly from Google from 2004 to present day for 15 popular keywords such as
- Recession
- Bear Market
- Market Crash
- Market Bottom
- Buy Gold
- Financial Crisis
- Bank Failures
- Open a trading account
- Best stocks to buy
- Day Trading
- Options Trading
- Unemployment Benefits
- Mortgage Rates
- Inflation
- Interest Rates
Spikes in web traffic for keywords such as Recession, Bear Market, Market Crash, Buy Gold may indicate increase fear. On the other hand, spikes in web traffic for keywords like best stocks to buy, day trading or options trading may signal a frothy market with extra retail participation. Finally, spikes in search volume for unemployment benefits, inflation, etc. may signal warning signs that the economy is not doing as well as recent numbers suggest.
Below you can see a plot of how search volume spiked for the keyword Recession around the 2020 Covid lows and again around the 2022 Inflation scare lows.
Dark Pool Index
The Dark Index (DIX) is a dollar-weighted measure of the Dark Pool Indicator on S&P 500 components that measures the dark pool short volume as reported by FINRA in its Reg SHO daily files. The calculation is
short off-exchange volume divided by all off-exchange volume. The indicator was first published here:
sqzme | Documentation (squeezemetrics.com)
The DIX creator states: “Because it rises and falls without regard to price, volatility, or gamma, it provides an uncorrelated signal that frequently tracks sentiment, whether or not that sentiment has been reflected in price“.
Using Dark Pool Index with Build Alpha
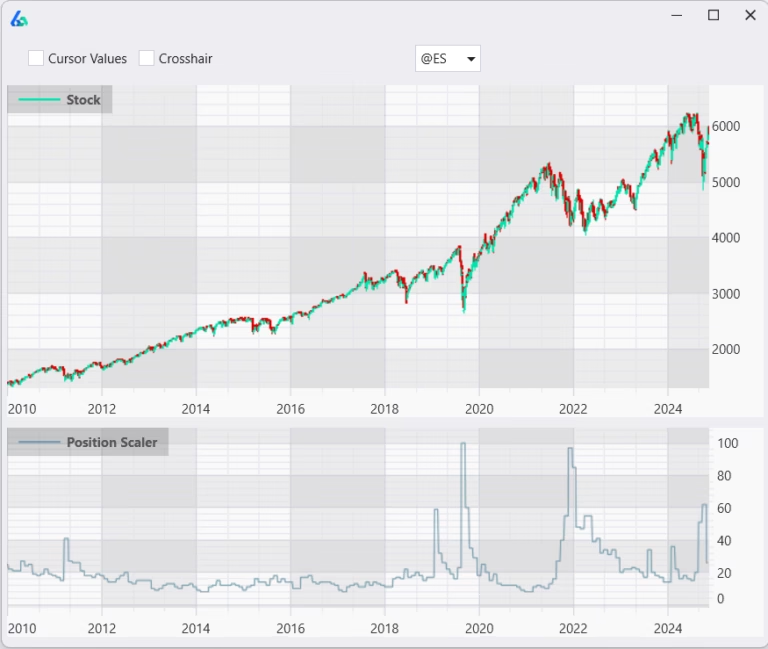
Dark Index is found in the Market Breadth signal category and is directly searchable. The values are a percentage of all off-exchange volume and scaled 0 to 100.
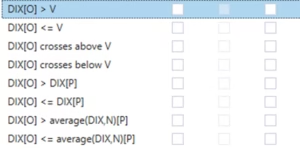
Build Alpha built-in Dark Pool Index signals – all optimizable
How Else to Use Market Breadth Signals
Build Alpha can use Market Breadth (actually any) signals as either
- Entry Signal
- A filter to turn a strategy ON/OFF
Let’s explore some other creative ways to use Market Breadth and Sentiment signals..
Combine Market Breadth with Price Action
The simplest place to start is to combine market breadth with price action signals. Build Alpha has signals
- Comparing OHLC values
- Candlesticks
- Quantified Chart Patterns
- Math manipulations to OHLC values
- Consecutive Higher or Lower
- Technical Analysis Indicators
- And More
The important question to ask is, does market breadth or sentiment affect the effectiveness of a price action pattern my trading system is using? If so, does the market breadth or sentiment signal warrant inclusion into my system?
If you do not know, then I suppose there is work to do!
Combine Market Breadth with Non-Price Based Signals
Build Alpha has other useful non-price based signals that can add context and help communicate the market environment to trading systems.
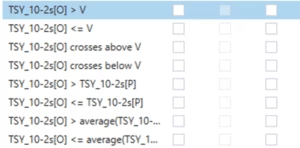
Treasury Yields and Spreads
Here are the signals available for the 10-2s yield curve depicted above.
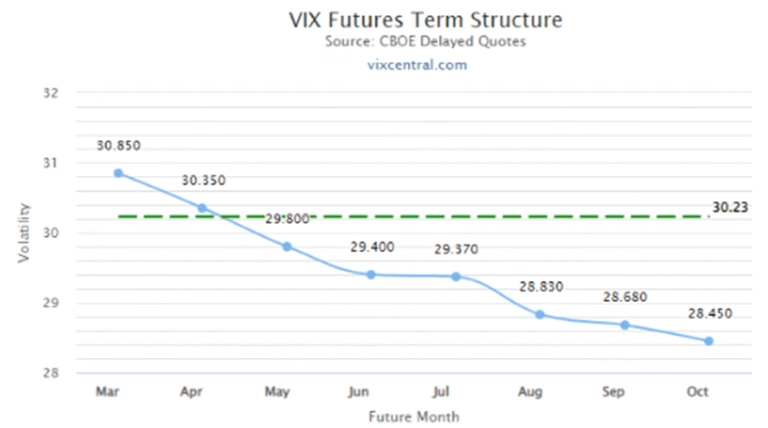
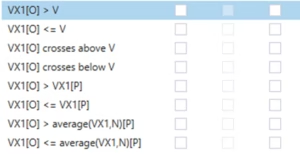
Volatility Index (VIX) Term Structure
Volatility Index Futures can give insights into how traders view risk in the near-term and longer-term. If front-month VIX futures are trading higher than the back of the curve (futures with a farther expiration date) then the VIX term structure is said to be inverted.
Inversion implies that investors now view risks greater in the near term than risks in the future, which should sound alarming because
volatility should increase with the square root of time as time increases.
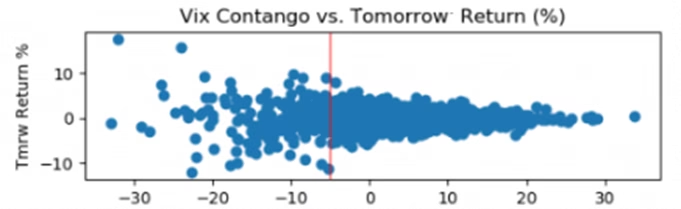
Build Alpha supports VIX signals across the entire curve as well as a few quantified metrics of the curve itself to capture contango or backwardation.
A quick visual showing how tomorrow’s S&P 500 Futures returns fair depending on the inversion of the VIX Term Structure (negative values >> more inverted)
Gamma Exposure
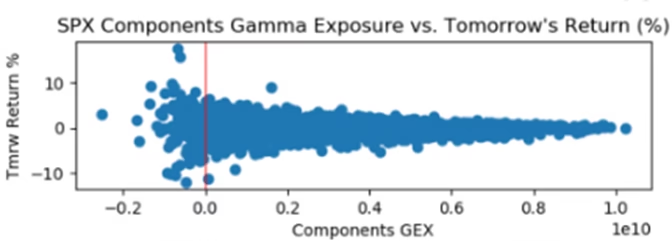
Gamma Exposure (GEX) is a dollar-denominated measure of option market-makers’ hedging obligations. In short, it is a ratio measuring the gamma of all the call option open interest to the gamma of all the put option open interest.
This calculation is typically done on the SPX index or on the individual stock components of SPX.
A positive or high gamma value will act as a brake on prices and as an accelerator when GEX is low or negative. Below you can see how SPX returns gyrate when GEX dips negative which can ultimately affect how your trading system performs.
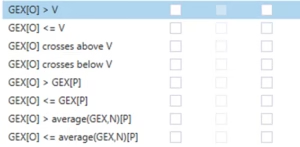
Build Alpha includes GEX signals on the SPX index as well as GEX calculated on the components under the Options Data signal category. Typical ranges are defined in the Signal Glossary / User Guide that accompanies the license.
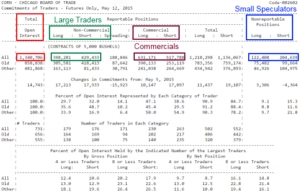
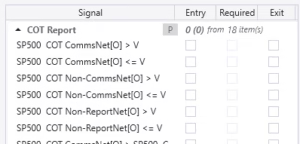
Commitment of Traders Report (COT Report)
The commitment of traders report is a weekly report released by the CFTC that discloses open interest or market positioning among the top 20 or so futures markets and options on futures markets.
The report is broken into three groups of traders: Commercials (hedgers), non-commercials (large speculators), and nonreportables (small speculators). The commercials and non-commercials are often referred to as “smart money” while the nonreportables are often considered the “dumb money” or retail crowd.
Build Alpha includes COT report signals for 15+ markets and counting and all values are represented as a percentage of total open interest.
Combine Market Breadth with News Event Trading
How does the market respond to a Nonfarm Payroll miss while investor sentiment is weak? How about when investor sentiment is strong? These questions should be investigated for successful trading. Build Alpha has all news event dates and economic values to test.
Read the full guide to see how trading systems can trade (or avoid) news event releases
Combine Market Breadth with Intermarket Analysis
The final point worth making is that most of the market breadth signals are stock market breadth signals; however, these can still be valuable to trading systems focusing on other markets such as Gold, Treasuries, or even commodities. I wrote more about
Intermarket Analysis in this post but wanted to explicitly clarify that one can use these Market Breadth signals with any asset, timeframe or bar type in Build Alpha.
Final Thoughts
A longer post than I anticipated, but there is a lot to do in Build Alpha. Market Breadth and Sentiment signals can provide much needed context for price action strategies and investment ideas. My motto is and always will be TEST EVERYTHING! And because of that I will continue to add new data sets, signals, and tests to Build Alpha. I hope these Market Breadth signals help.
Thanks for reading,
Author
David Bergstrom – the guy behind Build Alpha. I have spent a decade-plus in the professional trading world working as a market maker and quantitative strategy developer at a high frequency trading firm with a Chicago Mercantile Exchange (CME) seat, consulting for Hedge Funds, Commodity Trading Advisors (CTAs), Family Offices and Registered Investment Advisors (RIAs). I am a self-taught programmer utilizing C++, C# and python with a statistics background specializing in data science, machine learning and trading strategy development. I have been featured on Chatwithtraders.com, Bettersystemtrader.com, Desiretotrade.com, Quantocracy, Traderlife.com, Seeitmarket.com, Benzinga, TradeStation, NinjaTrader and more. Most of my experience has led me to a series of repeatable processes to find, create, test and implement algorithmic trading ideas in a robust manner. Build Alpha is the culmination of this process from start to finish. Please reach out to me directly at any time.