In this week’s Free Friday strategy (#10) I want to talk about one method of using Monte Carlo analysis to properly size a trading system – again, this is just one method!
The strategy itself is one created for the Semiconductor ETF or $SMH. All you Dow theorists – if any remain – can rejoice!
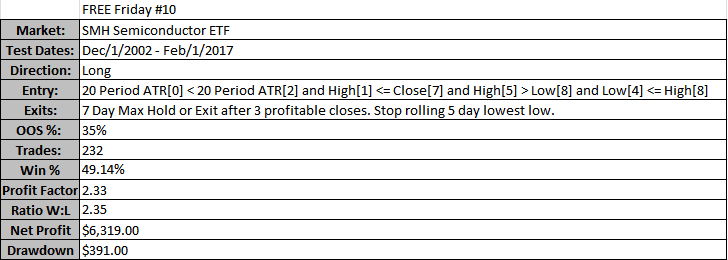
The strategy uses 4 rules for entry:
- 20 Period ATR[0] <= ATR[2]
- High[1] <= Close[7]
- High[5] > Low[8]
- Low[4] <= High[8]
**Remember [0] means current bar and [2] means 2 bars ago**
The exits used are a 7 day maximum hold or exit after 3 profitable closes. The stop will be a rolling 5 day minimum low. That is, stop out at the lowest low of the previous 5 days.

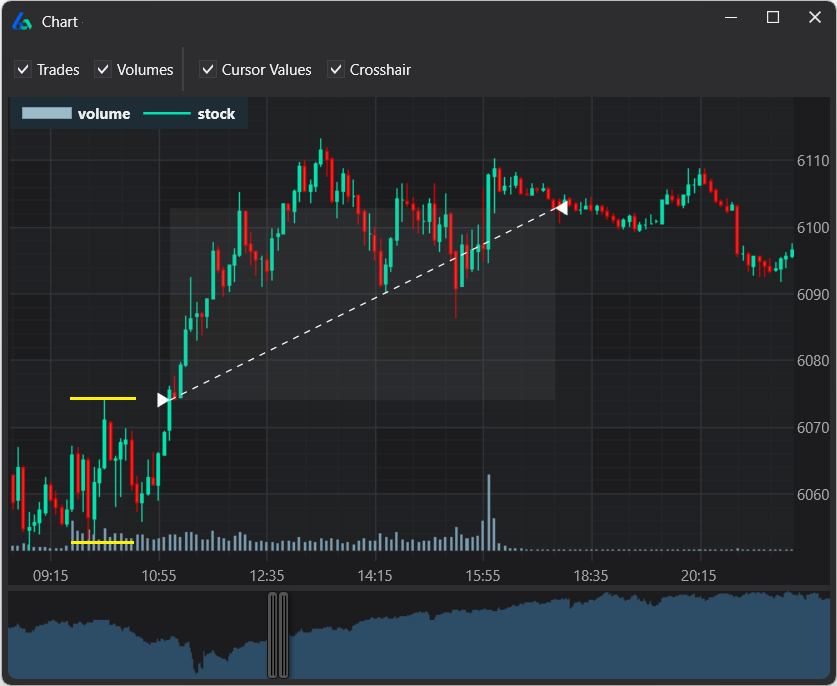
Couple quick notes. The chart on the left is from TradeStation and the chart on the right is from Build Alpha.
Notice TradeStation x-axis is trade number and Build Alpha x-axis is by date (both can display either way).
The grey line is buy and hold for SMH. You can see since early 2012 (the beginning of our out of sample period) we have much superior risk-adjusted return.
Also, please note that the test was done using only 100 shares per trade. This is essentially nothing, and does not account for underlying price changes over time, but this post is for demonstration purposes only.
Sizing with Monte Carlo Analysis
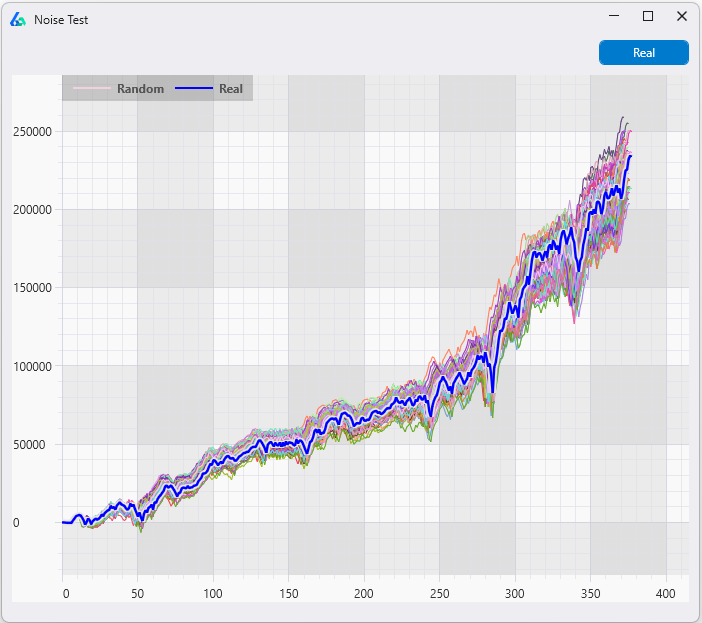
A quick recap of what a simple Monte Carlo test can be… we will reshuffle the order of the trades 1,000 times. Each time we will re-create an equity curve by adding the newly shuffled trades up one by one. Each time we will calculate a max drawdown as if the trades had actually happened in this shuffled order.
For the first test, I assumed an account size of $2,500.00. I ran the Monte Carlo test using Build Alpha which created 1,000 new drawdowns and the picture below. For example, the first Monte Carlo run (1 of 1000) might have calculated a $275.00 drawdown on the reshuffled trades or an 11% drawdown (275/2500). The second Monte Carlo run (2 of 1000) would reshuffle the trades and might recalculate the drawdown to be $450.00 on this random ordering of the trades; that would be an 18% drawdown (450/2500). After 1000 reshuffles we are left with the image below – all done instantly.
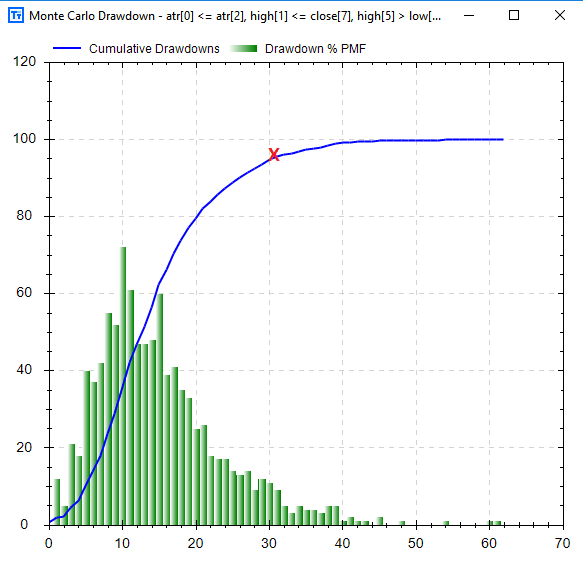
The green bars are just a frequency distribution of the [percentage] drawdowns. The blue, more important, line is a cumulative distribution which adds the green bars up as you move left to right.
The red “X” shows that 95% (y-axis) of all the drawdowns were less than or equal to 30% (x-axis). So we can say “we are 95% confident our drawdown should not exceed 30% of the our $2,500.00 account”. In other words, we have a 5% chance of experiencing a 30% or more drawdown trading this system.
Furthermore, the drawdown from the original backtest was 15.6% (391/2500) based on this $2,500.00 account. However, according to our Monte Carlo Drawdown analysis we have over a ~38% chance of realizing a drawdown equal to or greater than our max drawdown from the backtest of 15.6%! That’s too high and already Monte Carlo has helped make us more aware traders of the risk we are assuming. I calculated 38% by locating the blue line’s y-value where the x-axis was equal to our 15.6% drawdown. The blue line’s value was approximately 62. So 62% of our Monte Carlo drawdowns were less than or equal to our max drawdown from the backtest. In other words, a 38% chance to see a greater drawdown like I previously mentioned.
That is too high for me; a 30% drawdown can be unbearable and 30+% chance of exceeding our backtest drawdown is too high. Let’s increase our account size to $4,000 and re-run the Build Alpha Monte Carlo Drawdown analysis. Pictured below:
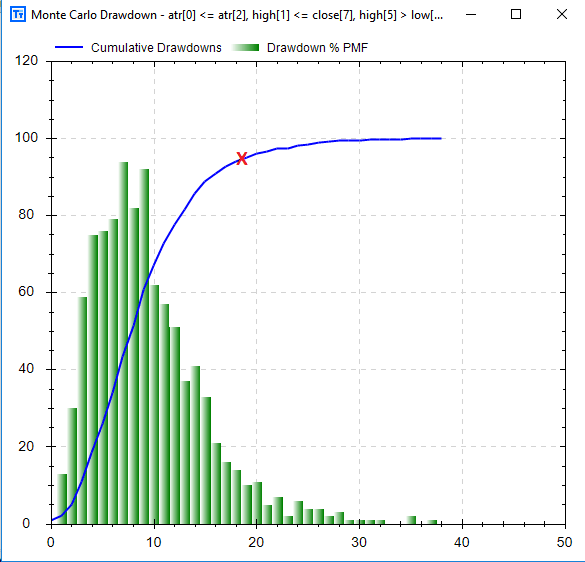
Now you can see that 95% of our drawdowns (red “X”) were 18% or less. In other words, there is only a 5% chance we will experience a drawdown of 20% or more using a $4,000 account. That is comfortable levels and chances of drawdown to most.
Now the question becomes… is setting aside $4,000 to COMFORTABLY trade this system worth the return this system can generate? That is a more personal question, but a question we will dive into in later posts.
Cheers and enjoy the 3-day weekend,
Dave
Old Posts:
- Free Friday 9 – Intermarket Signals
- Free Friday January 2017 Update
- Free Friday 8 – Randomized Monte Carlo
New Posts:
Thanks for reading,
Dave