What is a Robust Trading Strategy?
A robust trading strategy can withstand the tests of time and evolving market conditions. A large key to successful algorithmic trading lies in gauging how likely a strategy is to fail in new market conditions. A trading strategy that can deal with market shocks, volatility, changes, and price swings is a robust strategy. Robustness can be equated to reliability. Robustness Testing is key to identifying potential reliable trading systems.
What is a Robustness Test?
A stress test or statistical test to help validate or break an algorithmic trading strategy prior to risking real capital. Robustness tests help identify trading strategies that may fail in live trading prior to risking hard earned money. Avoiding bad trades and trading systems can be equally as important to reaching your trading goals as finding good strategies.
Trading losses make trading so much harder!
Warren Buffet, the greatest investor to ever live, is quoted as saying, “
the first rule of an investment is never lose money. And the second rule of an investment is never forget the first rule.”
Robustness testing or checks are stress test methods for measuring reliability in systems. These methods have the ability to identify lying
backtests, determine sufficient risk capital, and avoid catastrophic strategies before you potentially lose real capital.
Why are Robustness Checks important in Algorithmic Trading?
Too many algorithmic traders believe a backtest is enough to take a strategy live. Failing to check your strategy’s robustness can lead to substantial and quick losses when moving your strategy from the development stage to live trading.
A robustness check can help reduce the probabilities that a trader risks his hard-earned money on a lying backtest aka a strategy doomed to fail. Identifying strategies doomed to fail can help traders save capital.
Robustness checks allow the trader to make smarter decisions with his capital without being misled by lying backtests.
Additionally, the math behind avoiding losses is convincing
If you lose x% what gain is required to break even?
Warren Buffet is right. Losing money makes trading, and investing, much harder. If we have methods to help avoid losses, then what are they?
Do Robustness Tests and Checks guarantee Trading Success?
Nothing can guarantee trading or investing success. In this guide, I will walk through various robustness methods and checks that can help raise the probabilities we only risk capital on strategies with high chances of success. Nothing is a guarantee but shifting the odds in our favor is often good enough.
What are the best Robustness Tests for Algorithmic Trading Systems?
Each of these robustness techniques will be covered in detail in this guide. Feel free to skip ahead but I would not recommend it! First let’s cover some basics.
Why do my trading algorithm strategies fail?
Over the last ten years of professional trading experience and the last five plus years of interacting with the Build Alpha community, I have found there are two main reasons that trading strategies fail
There are certainly other reasons, but let’s take a moment to break down these two as they are undoubtedly the most common.
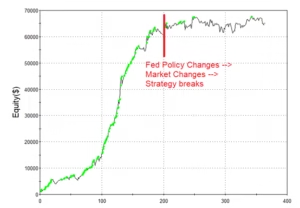
First, most strategy developers fail to include context into their strategy. Is it a bull market? Are interest rates rising or falling? Is inflation increasing or decreasing? Is the economy doing well? The market and big money players need large signals to move large amounts of money.
Most individual algo traders design strategies around price action signals or technical indicators and fail to account for market context. When the market changes, these strategies inevitably suffer.
Second, many strategy developers become obsessed with getting the best backtesting results possible. Traders will tweak strategy parameters until the backtest’s equity curve moves from the lower left to the upper right with zero turbulence. Ah, the perfect strategy!
These unrealistic expectations cause traders to overfit the history data. Is there a reason the 37-period moving average should work best? What if the 36-period and 38-period result in bad results and negative net profit or profit factor?
The live data will ALWAYS be different than the history data, so any strategy that needs new data to be nearly identical to the historical will fail in real trading and cause significant risk.
If you are looking to build your first automated trading strategy, add context to an existing strategy or want to see a complete guide to building automated trading systems, please check out this:
Algorithmic Trading Complete Guide
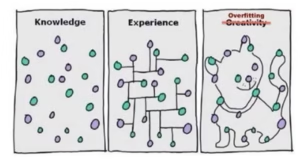
What is Overfitting and Over-optimization in strategy development?
Overfitting is creating a strategy that too perfectly fits the historical market data and will not generalize well on new unseen data. A trading strategy that memorizes the noise patterns of the historical data will fail when applied to new or unseen data.
An overfit strategy just learns the exact cadence of the historical market data but nothing useable going forward.
It is very unlikely the data actually created this cat. It is even more unlikely the next set of plots will create a milk saucer. Bad trading advice.
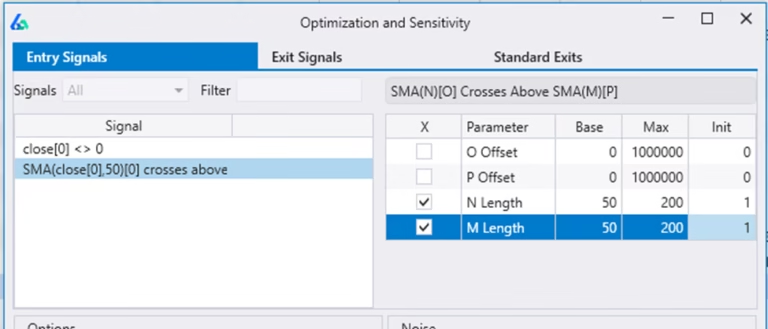
Many strategies have parameters that can be tweaked to improve the strategy’s historical performance. For example, a simple moving average system may buy when price moves above the 50-period moving average and sell when price falls below the 50-period moving average.
Traders will optimize this parameter setting of 50 to create the best possible backtest. Perhaps the best backtest results are generated when buying on a cross of the 63-period moving average and selling when price falls below the 12-period moving average.
Another example of overoptimizing would be to have very specific values such as a stop loss of $217.34 or using a signal such as 12-period RSI crosses above 66.19. These values may produce excellent historical winning trades but are surely meaningless as we go live, and we have unknown data.
This is particularly common in forex trading and strategy vendors.
Do not optimize every penny or hundredth to find the “holy grail”. It is the surest way to overfitting.
But how can we know if we have over optimized or found ideal strategy parameters? That is the need for Robustness testing or strategy robustness!
What are the best robustness tests for algo trading strategies?
There is no single best test and depending on the strategy’s characteristics other statistical tests may be more valuable to what you are trying to disprove than others. For example, a trend following strategy should be tested a different way than a mean reversion strategy. Let’s walk through some examples and circle back to identify a good strategy.
In Sample and Out of Sample Testing
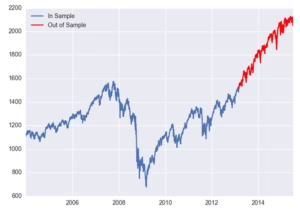
The simplest test we can implement as a first line of defense against curve fitting is an in-sample and out-of-sample split. Most traders use the first 70% of their historical price data as the in-sample data and the last 30% as their out-of-sample data.
First, build a trading algorithm on the first 70% where you can tweak, optimize input parameters, add or delete rules, etc. Once pleased with the trading algo’s results, we can test on the unseen, untouched out-of-sample data.
If the strategy performs well on the out-of-sample data then it is a good sign that the strategy may hold up well on live, unseen data.
There are many considerations with out of sample testing such as where to split the data, how much data is needed and more. To dive deeper, check out
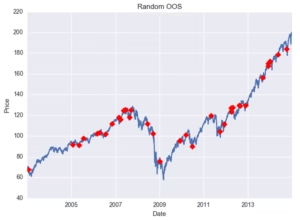
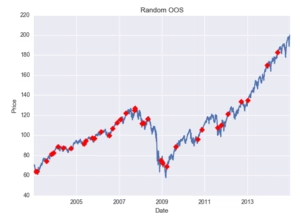
Randomized Out of Sample Testing
What if the out-of-sample data was the beginning of a monster bull market? Is it possible our great out-of-sample results are lucky and we are at high risk? Any strategy could have done well during this out-of-sample period.
This is certainly a risk with out-of-sample testing, but we know how to combat this! If you do not wisely select your in and out of sample split, then you could utilize the Randomized Out of Sample test.
This test simply selects random bars and assigns them to either the in-sample or out-of-sample portion. Then we trade on our data and take any trades entered on in-sample dates to be the in-sample trades and any trades entered on randomly selected out-of-sample dates to be the out-of-sample trades.
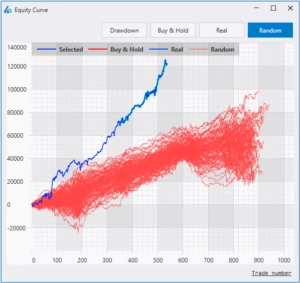
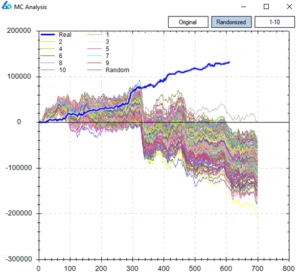
Vs Random: using the best random trading strategy as a benchmark
One of my favorite tests, I even mentioned it in the Algorithmic Trading Guide linked above. This test comes from Jaffray Woodriff of Quantitative Investment Management and aims to answer the question, could we have done this well by luck?
The test generates the best possible random strategy by using random data with real signals, random signals with real data, a combination or mix of the two, etc. The goal for any trading strategy is to have better performance metrics than the best random strategy.
If our research can beat the best random strategy, then we can have confidence the strategy contains real edge and could not be produced by chance (random).
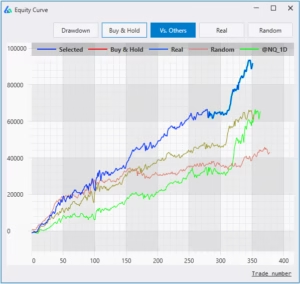
Vs Other: testing trading strategies on other markets
Ideally, we want to see trading systems do well across various related markets. A trading strategy on SPY should do well on other markets such as QQQ or DIA. If a strategy performs terribly on related markets, then it is likely the strategy was overfit to the noise in SPY’s historical market data.
It is often unnecessary for a strategy to perform well on unrelated markets as market participants may vary drastically creating different data characteristics. Equities have a natural upward drift as companies exist to make money. Oil and corn have natural producers and consumers whereas stocks do not. Forex trading has no central exchange.
These differing dynamics bring different traders, hedgers, and investors to the respective markets. These different players leave different footprints thus possibly rendering a strategy that works in one area useless in another.
Of course, a strategy that does well across all markets – related or not – is ideal. However, these are often very hard to come by.
Vs Shifted: shifting the data to re-test trading strategies
Every charting and data provider uses hourly data from the top of the hour to the end of the hour. That is, 10:00 to 11:00, 11:00 to 12:00, and so on. However, what if we shift the opening and closing time by 1 minute? By 2 minutes, by 3 minutes, etc.? Maybe our shifted data now opens at 10:03 and closes at 11:03, for example.
Now we have additional data that has the same properties but isn’t identical to the historical market data we built our strategy upon. This data is good to evaluate if our strategy requires the exact historical data patterns for success or not.
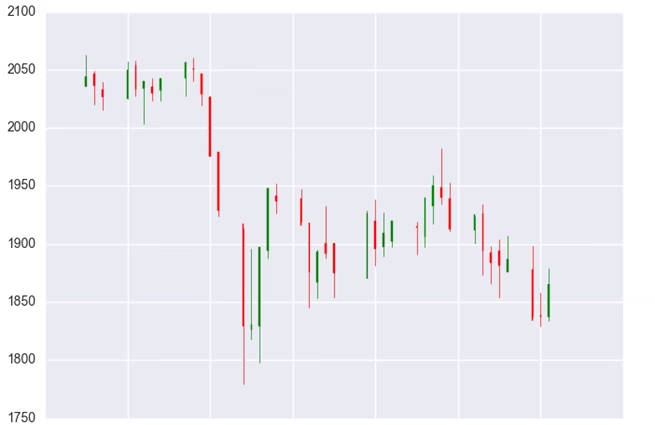
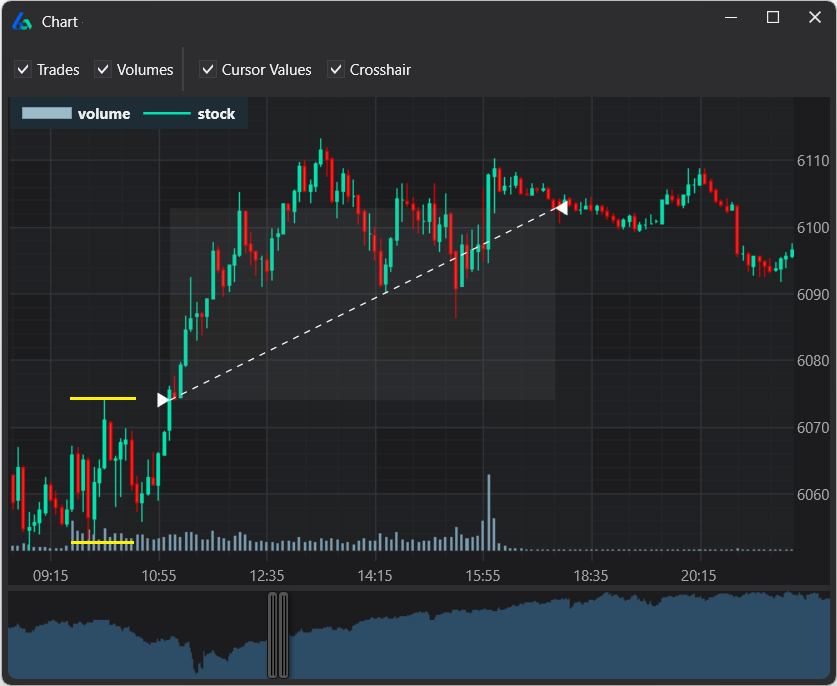
Shifting the data works on any timeframe and may change bar patterns, high and lows, consecutive up or down streaks, indicator calculations, and more. A long strategy needing four consecutive red bars and a close in the bottom 20% would trigger a big win on the left but would not enter on the right.
Re-trading your strategy on shifted data can give insights on how overfit your strategy was to the exact patterns available in the historical market data. Past performance should maintain across shifted data sets. If performance degrades on shifted data, then it may be a warning sign your strategy is over optimized.
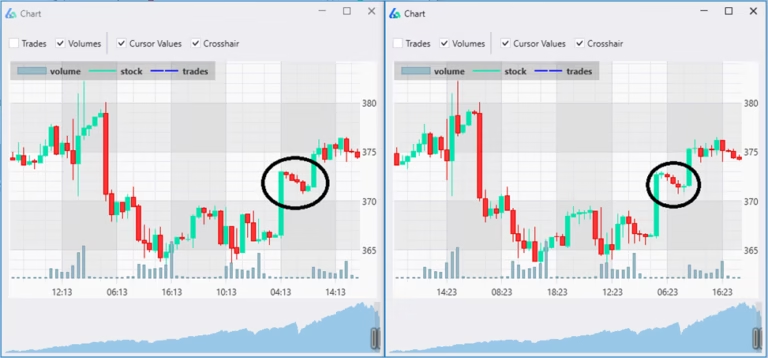
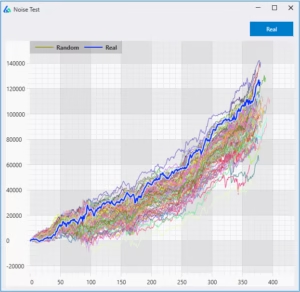
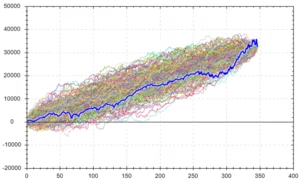
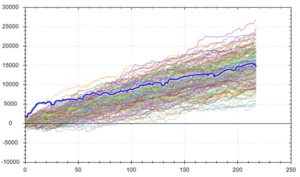
The Noise Test for robust algorithmic strategies
Overfitting a strategy simply means fitting to the noise of the data and not to an underlying signal. The book
The Signal and the Noise does a better job than I can differentiating the two. However, we want to find true signals not noise. Noise is random and unreliable.
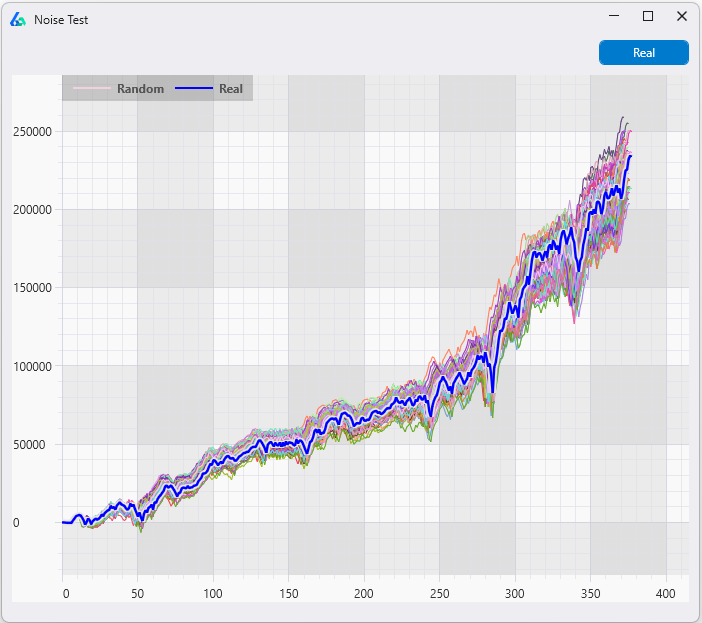
How can check if we have overfit to the noise in historical market data? We can noise-adjust the historical data by adding or subtracting various amounts of noise (volatility) to the historical price bars. This will create a new open, high, low, close series for us to test our strategy on.
A strategy waiting for four straight green closes to initiate a short entry would take a trade on the original data, but have the trade skipped in these two noise-adjusted variations at the circled bar.
Repeating this noise test to generate 1,000 or more new noise-adjusted data sets is a good start. Then we can re-trade the same strategy 1,000 times and view how the same strategy would perform if the noise wasn’t exactly how it was in the historical data.
If the noise adjusted results are no longer profitable, then the strategy was fit to the historical noise. If the noise test remains profitable then we can have increased confidence our strategy was not overfit to the historical noise.
To read more about the specifics of the noise test please check out a couple of these articles I wrote
Monte Carlo Simulation for Trading Strategy Development
The most popular robustness testing method. There are many variations and uses of Monte Carlo Simulations and Monte Carlo analysis so let’s break down a few below:
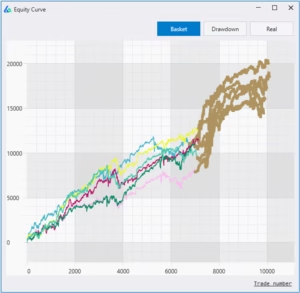
Reshuffle – reshuffle the order of historical trades and repeat 1,000 times to create 1,000 new equity curves. Since we are reshuffling the order, we end at the same spot, but the path changes, showing how our account could have fared if the trades did not play out in the sequence they did. You will notice a larger maximum drawdown than the backtest.
Resample – randomly select a historical trade until you reach your backtest’s total trade count. You can randomly select the same trade aka resampling with replacement. Repeat 1,000 times until you have 1,000 equity curves. Since we allow for the selection of the same trade, we do not end at the same spot. This test can provide more variation as the worst (or best) trade can be selected multiple times.
Advanced Monte Carlo Tests for Trading Algorithms
Randomized – We can randomize the entry and re-trade our strategy 1,000 times. On the other hand, we can re-trade our entries and randomize the exit. If your original strategy had no stop loss, then you should not randomly apply one. We should only randomly select and vary exit logic in the original strategy. If the Randomized Monte Carlo remains profitable, then it is likely we have true edge in our entry.
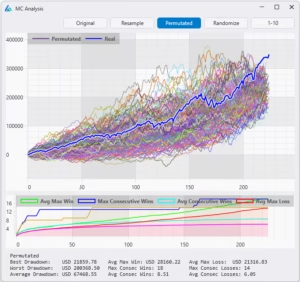
Permutation – reshuffling the log of inter and intrabar price changes then exponentiating to recreate new bars. This creates synthetic data containing most of the statistical properties of our original data while destroying most of the patterns. We can re-trade our strategy on 1,000 new synthetic data series to see if our strategy holds up. This technique was popularized by Timothy Masters in his latest book
Permutation and Randomization Test for Trading System Development.
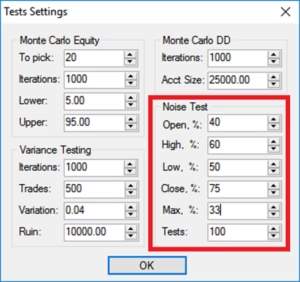
Variance Testing for Trading Strategy Validation and analysis
The variance test takes the historical trades and creates a probable distribution to resample. Next, the test selects random trades from this distribution until it reaches the backtest’s total trade count. It repeats this process 1,000 times.
The trader can vary a performance metric, so the test only accepts variations that perform below the original backtest’s metric minus the trader’s input. The trader can now view how varying performance metrics affects the strategy’s variance.
For example, assume the backtest had a win percentage of 61% and the trader set the test variation to 5%. The variance test would only display variations that had a win percentage of 56% or lower.
This test allows a trader to view how a strategy would perform if things do not go as the backtest suggests they should. News flash – things never go as well as the backtest suggests. Now, the trader can answer if he would be comfortable trading this strategy in this less rosy situation.
In the above image, we have two Variance Test results. The left side shows the strategy with 0% variation accepting all strategies from the simulation. The right-side shows variance test results with 5% variance selected – meaning only accepting strategies with win percentages 5% below the original backtest’s win percentage.
If live trading were to go 5% worse than our backtest, our strategy is a mere toss-up. A 50-50 bet is never how we want to risk hard earned capital. We want strategies that can maintain performance with slightly less optimistic metrics than the backtest.
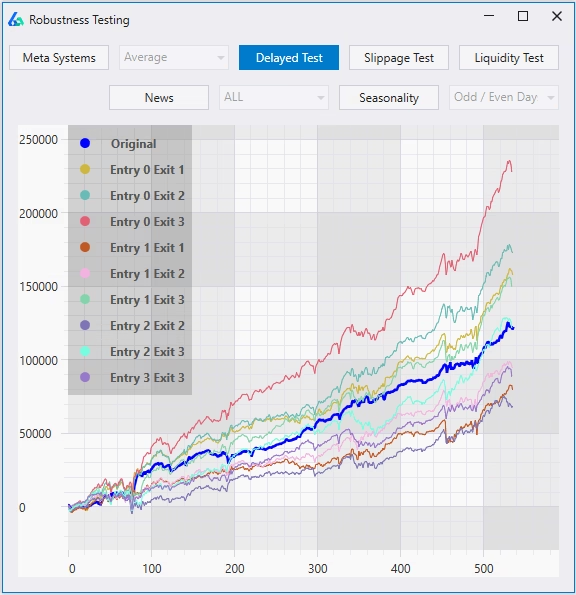
Delayed Testing
Delaying a strategy’s entry or exit can be a useful test to determine we have not overlooked more optimal entry or exit points but can also tell us how fragile our strategy may be. If the strategy cannot enter 1 or 2 bars later or exit 1 or 2 bars later, especially for intraday, then the strategy may be showing signs of overfitting.
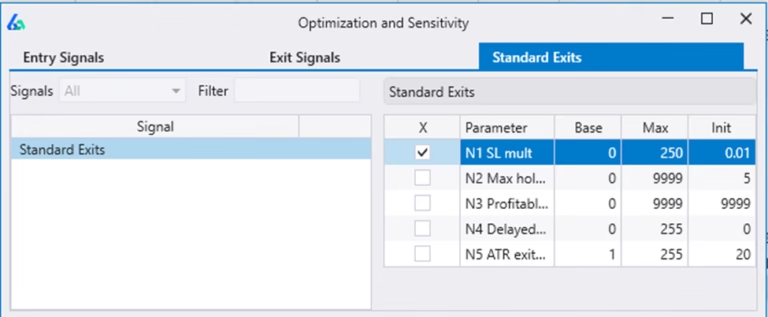
Often a strategy may do better with a delayed entry as a strategy becomes known others begin to front run the entry and then bail when it does not work immediately. Build Alpha permits the option to add delayed entries to any strategy from the settings menu.
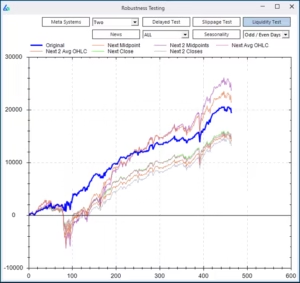
Liquidity Testing
Large traders and institutions cannot execute their entire size on the open or the close. The liquidity test shows how a strategy would perform assuming the trader needed to enter from the close and until the next day’s close by taking an average of the two.
The liquidity test also tests the close and the next open and the close to the next midpoint. This test can also serve that if an entry or exit were to be missed does it make sense to put the trade on late.
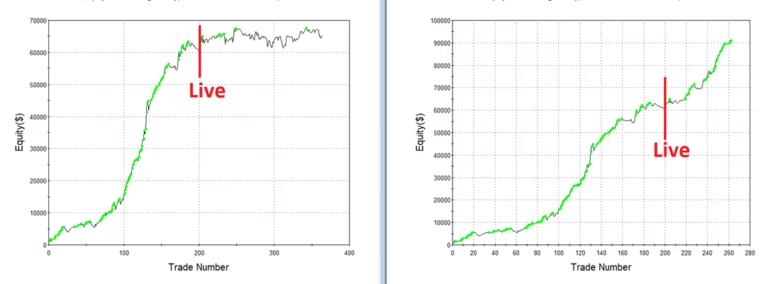
This example strategy showed promise, but if you cannot get the exact fills and need to scale-in or out due to size then this strategy shows a significantly different drawdown in both 2008 and 2020 market shocks. This could mean substantial risk to your initial investment.
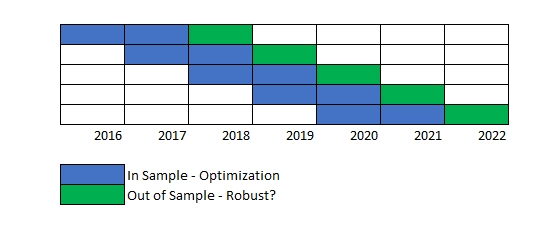
Walk Forward Testing
Walk forward tests smaller in and out of sample periods across the entire period tested on a rolling basis. Re-optimizing each in-sample period then trading the out-of-sample period with the selected parameter settings.
The test then combines all the out of sample periods as your final out of sample results (equity curve).
Below you can see Build Alpha’s Walk Forward results window. The top row is the combined equity curve of all the out-of-sample periods.
Each row below contains the results from one of the out-of-sample periods or “splits”. This allows traders to inspect as granularly as needed.
Is Walk Forward a valid approach?
Mainly, walk forward analysis only tests a single price path whereas other tests such as Noise testing, Vs Shifted, Variance testing or Monte Carlo Permutation test multiple price paths.
Additionally, due to test design, walk forward analysis splits the data many times creating an increase in data leakage. That is where data from an in-sample period is used during an out-of-sample period.
The simplest example is to imagine a trading strategy that uses a 200-period simple moving average. The first 199 bars after each data split will reference data from the previous in-sample period. More splits, more leakage.
There are many other pitfalls to walk forward despite its popularity. Remember, robustness testing is about finding what will provide a strong Sharpe ratio and trading performance in the probable future not what has done so on the known historical price path.
The full Walk Forward Testing article is here.
Robustness testing parameters through Sensitivity Analysis
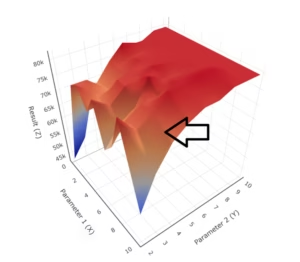
Optimizing parameters often leads to more fragile strategies as the risks of overfitting often skyrocket. However, how can we find robust parameters? The simplest rule of thumb is to look for parameters areas that all show similar performance.
That is, if the best parameter setting is 20 then we should aim to see at least +/- 10% showing about as good of performance. In this case, we want to see values 18 to 22 produce similar backtest metrics.
If the parameter values next to the optimal parameter setting causes a large drop in performance, then the optimal parameter setting is too fragile and likely just overfit to the historical data. This trouble can be easily avoided by using 3D surface graphs.
Choosing a parameter value here is too risky as the performance nearby drops significantly. On the other hand, choosing a parameter value in the red section provides a greater perceived margin of safety as the neighboring values show similar performance.
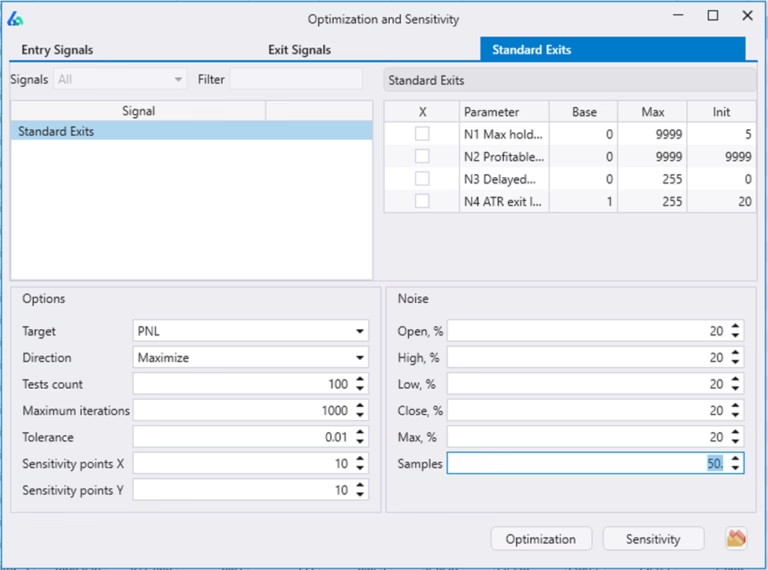
Noise Test Parameter Optimization for trading strategies
Build Alpha takes parameter optimization one step farther equipping you with an additional robust check to the parameter selection process. Build Alpha enables the trader to add noise-adjusted samples to the optimization process so Build Alpha will find what parameter settings work best across all the noise-adjusted sample.
Combining parameter values in a stable region with good performing neighbors and the great performance across noise adjusted data sets then we are doing as much as we can to shift the probabilities in our favor.
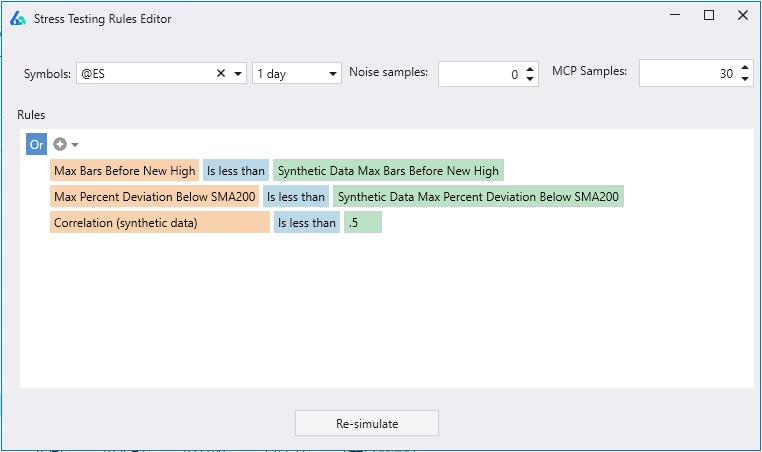
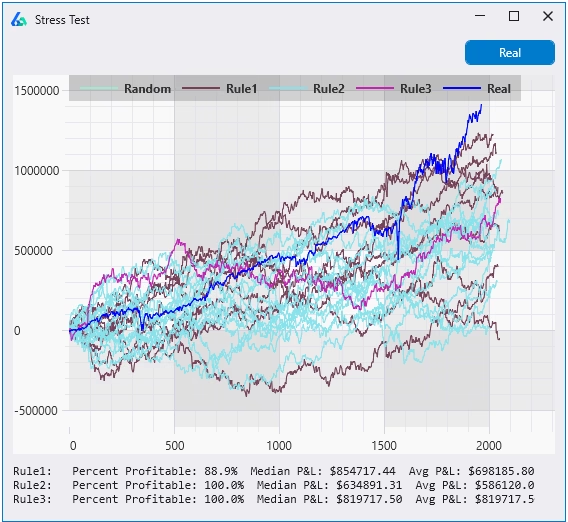
Stress Testing or Scenario Testing with Synthetic Data
Market shocks are often what gets system traders in trouble. Build Alpha now lets you generate synthetic data with your desired “shocks” to test your strategy against.
You can choose various data generation methods such as noise adjusted data and monte carlo permutated data and also create custom rules such as the synthetic data must have a larger drawdown than the historical data or must take longer to recover from its max drawdown or a whole host of other ideas.
After hitting test, Build Alpha will generate synthetic data sets and only test your strategy against the ones that match your desired rules.
Stress Testing rules can be combined or treated as unique, individual rules. In the latter case, Build Alpha will give each rule its own unique color in the plot so you can evaluate strategy performance across your rule set.
Summary statistics are provided for each rule below the display.
Should my trading strategy pass every robustness test?
In a perfect world, yes. However, as algorithmic traders, we rarely live in a perfect world. Robustness testing is to help us avoid avoidable catastrophe but is not a crystal ball, unfortunately.
We can never prevent overfitting or truly know if we have not overfit. All we can do is attempt to lower the probabilities that we have overfit, and these stress-test methods help.
Trend following strategies tend to have lower win rates as they look for large, outsized moves. Running a trend following strategy through the variance test while reducing the win percentage does not have much of an affect. On the other hand, adjusting the noise for a trend following strategy seems applicable.
Thinking through what each test is testing and what your strategy is attempting to capture can help find the right tests for each specific strategy.
Remember, putting strategies on a simulated account or trading with reduced size can be another form of checking robustness on live data.
Robustness testing on my trading portfolio or on individual strategies?
Yes, you should do robustness testing on both individual strategies and your portfolio. Build Alpha provides the tools to run all the robustness checks and tests on both individual strategies and portfolios of strategies.
In the previously linked Algorithmic Trading Guide I shared my thoughts on how to build a proper trading portfolio. In this guide, I make the case that bad standalone strategies may have a place in your portfolio as they can “do the dirty work” to assist your star players. These role player strategies will rarely pass robustness tests; however, adding them to your portfolio should not harm the robustness tests of your portfolio!
Robustness Testing Takeaways
Need to Knows
Summary: Robust Trading Strategies require additional testing
Many traders struggle to make algorithmic trading work, but when looking at trading software available it is clear. Robustness testing is not offered in nearly any software. That is why I set out to build Build Alpha and include the various robustness tests and robustness check I have come across over the past decade in my professional trading career. Strategies must survive multiple and ever-changing market conditions.
Robust trading systems are rare and will require the astute trader to discard many strategies in the process. However, discarding strategies before risking hard earned capital is a win in my book. I hope this guide helps you break your strategies before the market does. In the long run, running additional tests and avoiding losses where possible can have a tremendous impact on achieving your trading goals and how a strategy performs.
If you have any questions or additional insights, please feel free to email me anytime.
Author
David Bergstrom – the guy behind Build Alpha. I have spent a decade-plus in the professional trading world working as a market maker and quantitative strategy developer at a high frequency trading firm with a Chicago Mercantile Exchange (CME) seat, consulting for Hedge Funds, Commodity Trading Advisors (CTAs), Family Offices and Registered Investment Advisors (RIAs). I am a self-taught programmer utilizing C++, C# and python with a statistics background specializing in data science, machine learning and trading strategy development. I have been featured on Chatwithtraders.com, Bettersystemtrader.com, Desiretotrade.com, Quantocracy, Traderlife.com, Seeitmarket.com, Benzinga, TradeStation, NinjaTrader and more. Most of my experience has led me to a series of repeatable processes to find, create, test and implement algorithmic trading ideas in a robust manner. Build Alpha is the culmination of this process from start to finish. Please reach out to me directly at any time.