Build Strategies Across
the Multiverse of Price Paths
The historical data is one path. The future is another. Train your strategies across hundreds of synthetic price series — noise-adjusted, Monte Carlo permutated, and Vs Shifted — so they survive whatever comes next.
Part of the Robustness Testing Guide — 12+ stress tests for algo trading
Why One Historical Path Is Not Enough
All system traders aim to build more robust strategies and bullet-proof their portfolios. But most traders are stuck training on the historical data that every other participant has. We do not want strategies reliant on one market environment persisting forever — that simply is not the way things are.
A robust strategy can withstand changes to the market and continue to perform. It is not dependent on things remaining the same. Our goal: find strategies that handle varying amounts of noise, volatility, sequences of prices, or even price shocks. One way to better do that is by introducing synthetic data to the building process.
Multi-Path vs. Single Path
For decades, system traders have developed strategies on only historical price data. But historical data represents a single path of what actually happened (green below), while various paths were possible (black below) and can exist going forward.
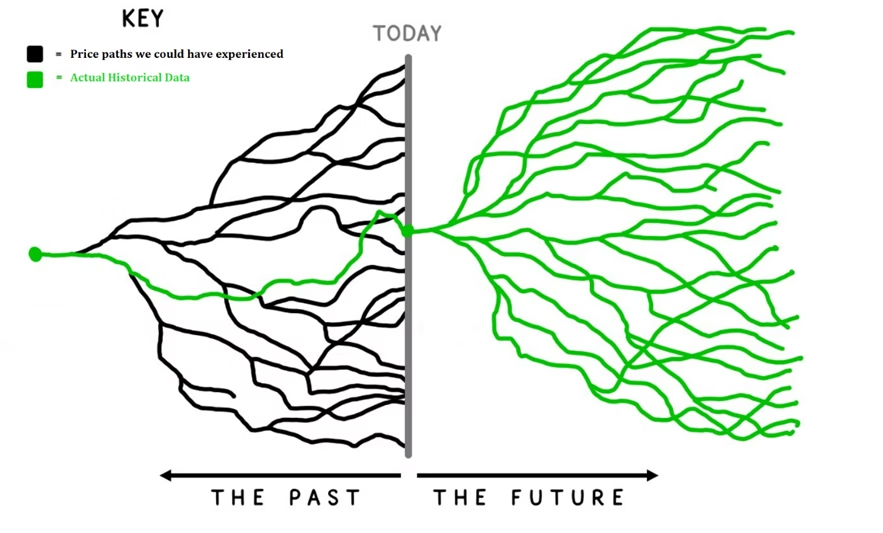
Instead of building strategies on a single path, why not build strategies on the many paths that could have happened? A favorite trading quote: “do not develop for the knowable past but rather for the probable future.”
???? Alternate Realities
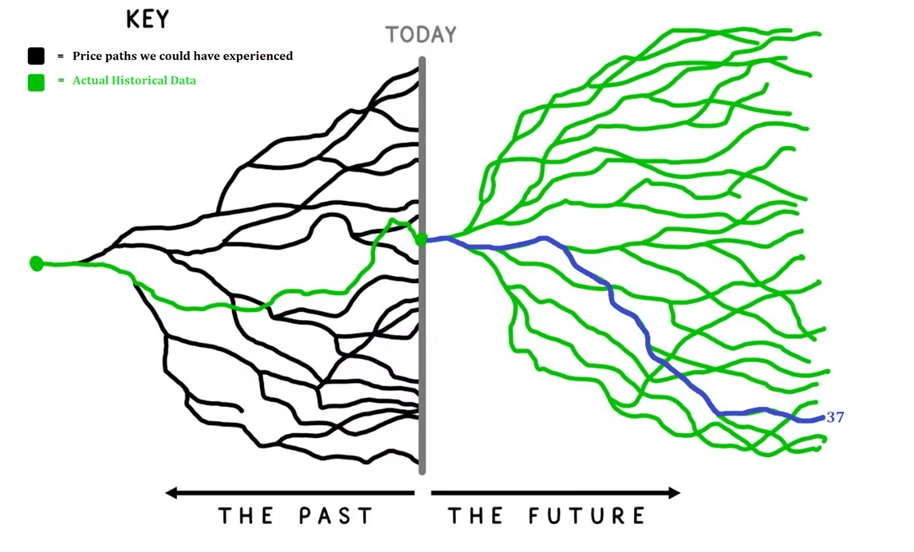
Think of these paths as parallel universes. In our universe, prices behaved how they behaved. But alternate realities could have existed and their prices may have played out differently. Furthermore, we may soon jump to one of these realities. What if the future takes path #37 but you only trained on the single historical green line?
The actual historical path. All-time highs at the known dates.
Noise-adjusted. Earlier ATH, different volatility clusters.
MC permutated. Same endpoint, entirely different path.
Vs Shifted. Same market, different bar boundaries.
By creating strategies across multiple data series, we aim to capture the underlying signal rather than the noise (randomness) in any one specific universe.
Pre-Simulation vs. Post-Simulation
Build Alpha has always enabled traders to use synthetic data to test strategies from a robustness testing standpoint (post-simulation). Now you can include this data before the simulation engine or genetic algorithm begins — for the strategy discovery process itself.
Build strategy on historical data first, then validate by re-trading on synthetic series.
- Noise Test — detect overfitting
- Monte Carlo — stress drawdowns
- Strategy already locked in
Add synthetic series to the genetic algorithm. Strategies trained across all paths simultaneously.
- Discovery accounts for alternate realities
- Rules must work across the multiverse
- Fundamentally more robust from the start
Both approaches have value, and using them together is ideal. Build on synthetic data first, then validate survivors with post-simulation Noise Test, Monte Carlo, and out-of-sample testing.
Synthetic Data Methods
How can we create synthetic data? Below are the methods Build Alpha supports, ranging from simple to advanced. Building strategies on a variety of methods diversifies away pitfalls from relying on any single generation approach.
Shifts bar open/close times by 1, 2, 3+ minutes — creating data with the same characteristics but different OHLCV values, patterns, highs/lows, and indicator calculations.
Control: shift amount, any timeframe
Result: same market, different bars
Randomly adds or subtracts volatility (as a % of ATR) to each bar, creating thousands of new synthetic price series. Helps avoid fitting to the specific noise of one data set.
Control: bars affected + magnitude
Result: same structure, different noise
From Timothy Masters’ book — reshuffles the log of inter and intrabar price changes then exponentiates back into raw OHLC. Retains statistical properties but destroys patterns.
Control: permutation parameters
Result: same distribution, new path
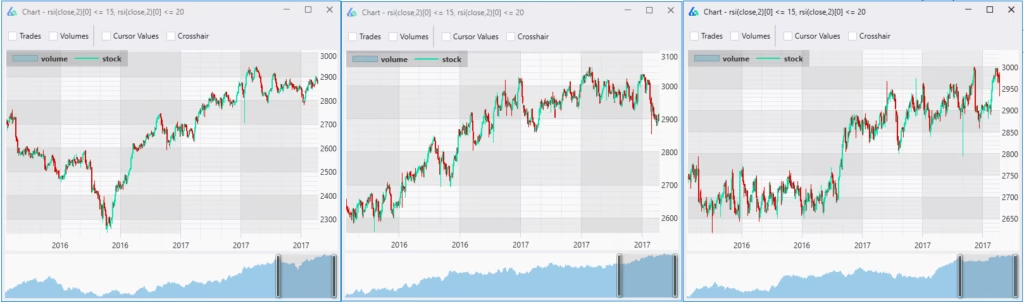
Vs Shifted in Detail
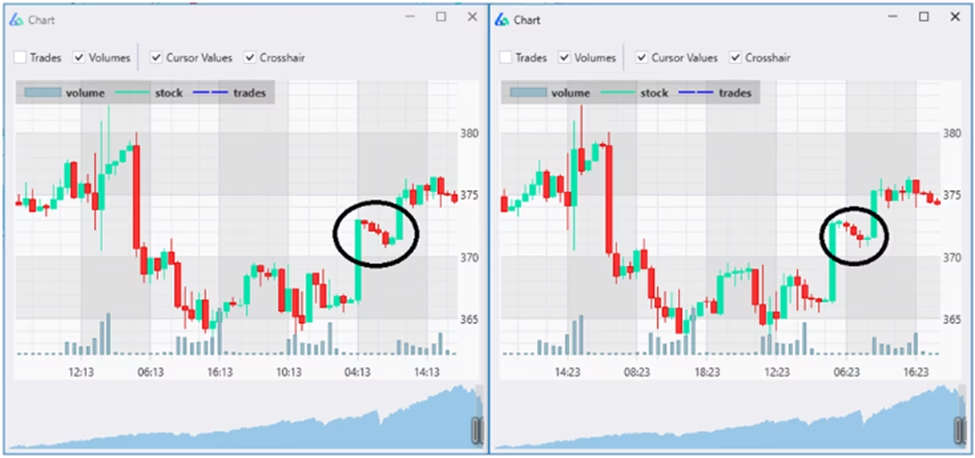
Standard 15-minute data creates bars at 0:00, 0:15, 0:30, 0:45. But what if we shifted to 9:03–9:18, 9:18–9:33, etc.? Or 9:06–9:21? Each shift creates a new data series with the same characteristics but different OHLCV values. Patterns are the same but the specifics are not:
Noise-Adjusted in Detail
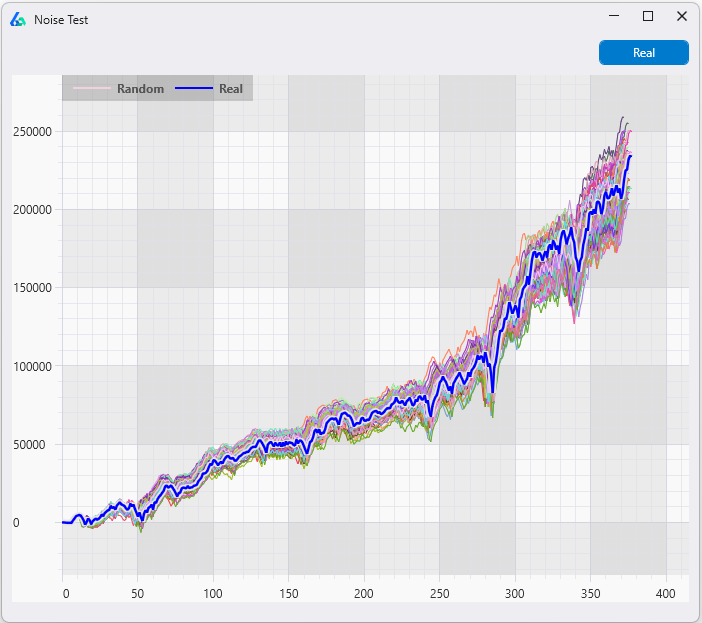
Noise-adjusted data randomly adds or subtracts volatility to each bar. The animated example below shows how adjusting the noise alters the same data — each frame is a different noise-adjusted series. For deeper dives see: Noise Test — When OOS Is Not Enough, Noise Test Strategy Example, and Noise Test Parameter Optimization.
Monte Carlo Permutation in Detail
From Timothy Masters’ Permutation and Randomization Tests for Trading System Development — the MCP method reshuffles log inter and intrabar price changes, then exponentiates them back into raw OHLC prices. The result: data with the same statistical fingerprint but completely different price paths.
You can read more about this test and other Monte Carlo methods in the complete Monte Carlo Simulation Guide which includes a free simulator.
Advanced Machine Learning (GANs & Deep Learning)
Many machine learning methods lend themselves to generating synthetic data. Generative Adversarial Networks (GANs) and deep learning approaches can learn the distribution of historical price data and generate entirely new series that exhibit similar statistical properties — regime clustering, fat tails, volatility persistence — without being a transformation of the original data. These are frontier methods that go beyond simple permutation or noise injection.
???? GANs for Synthetic Data
GANs train two neural networks against each other: one generates synthetic data, the other tries to distinguish it from real data. The result is synthetic price data that is statistically indistinguishable from actual market data — a powerful way to expand your training set beyond simple transformations of the historical path.
Custom Data Import
Build Alpha also supports custom data imports — if you have an alternative generative method (your own GAN, deep learning model, or any other approach), you can add your own synthetic data to the build process via CSV or TXT file.
Why Not Just Use Other Markets?
You can! Building strategies on other markets is another great idea, discussed in Testing Across Markets and Trigger Signals. However, other markets often have different players, point values, volatility ranges, and hedging use cases. Despite heavy correlations, the underlying pattern may not exist across markets — resulting in an insufficient test.
The best approach combines all available methods in your portfolio construction:
- A single market
- A single market plus related markets
- A single market plus unrelated markets
- A single market plus synthetic data
- A single market plus related markets plus synthetic data
There is no single best approach. We constantly aim to equip ourselves with robust strategies built on different methods to best handle changing markets.
Setting Up Synthetic Data in Build Alpha
After selecting the market you want to trade (can be multiple markets), hit the Additional Data button to create as many synthetic data series as needed. Below shows SP500 Emini Futures with 9 additional data series — three from each method: Vs Shifted, Noise Adjusted, and Monte Carlo Permutation.
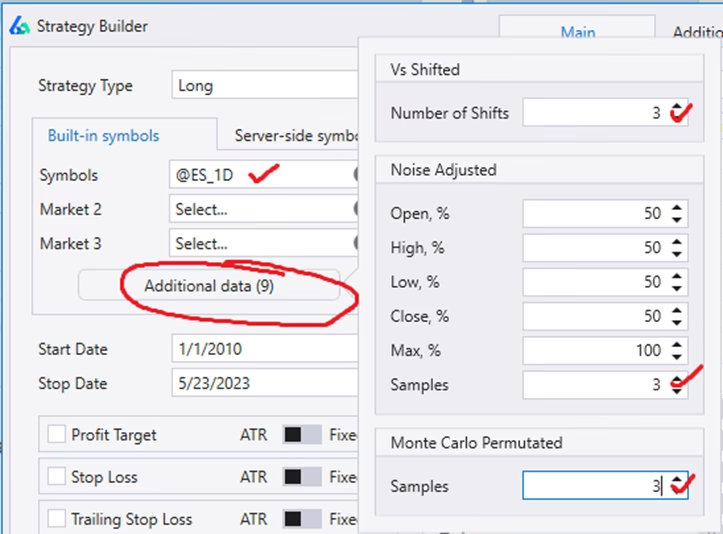
???? Note on Multi-Symbol
If you select multiple symbols (e.g. @ES and @GC), the above configuration creates 18 synthetic data series — 9 for each symbol. The synthetic data scales with your symbol universe automatically.
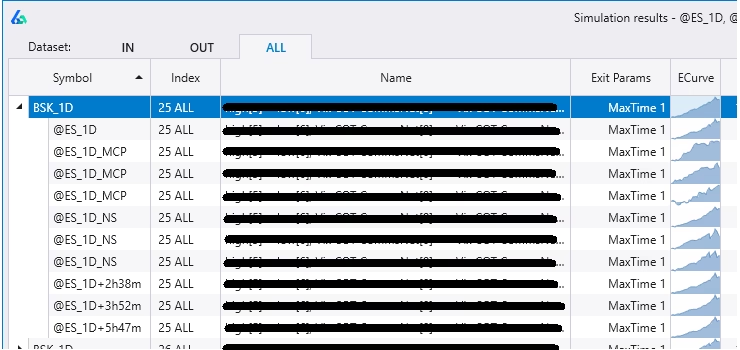
Basket (BSK) Results
After simulating with added synthetic data, Build Alpha’s results window shows ‘BSK’ results — the strategies that performed best across the entire basket. Expand the BSK row to view how the strategy did on each individual data series:
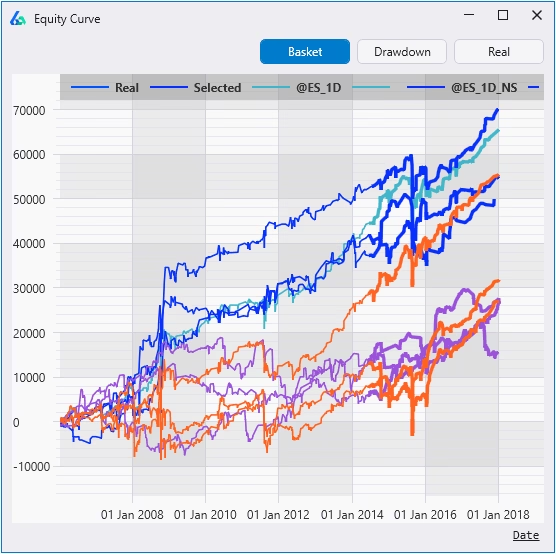
Basket Equity Curve Graph
Alternatively, view the equity curve and hit the ‘Basket’ button to overlay the selected strategy’s performance on each synthetic series. Each generation method has its own color:
Orange = Vs Shifted
Blue = Noise Adjusted
Purple = Monte Carlo Permutation
Custom Rules: Filter Your Multiverse
Build Alpha’s no-code rule builder lets you qualify which synthetic series make it into training. Set rules so the data matches the stress scenarios you want to prepare for:
Only use series with 0.25–0.75 correlation to original
Synthetic must have deeper drawdowns than history
Must take longer to recover from max drawdown
Require increased volatility regimes in synthetic data
Chain rules with OR — each gets its own color on the chart
View how each rule performed independently below the display
Synthetic Data in Walk-Forward Optimization
Build Alpha’s walk-forward optimizer can inject synthetic data into the process. Select Simulate with Synthetic Data, choose the symbol, timeframe, and data-generation methods, then set qualifying rules.
For example, Build Alpha creates 200 synthetic series but only includes those with correlation between 0.25 and 0.75 to the original. The synthetic results are included in pass/fail scoring — parameters must work across both the historical path and synthetic series to pass. See also Noise Test Parameter Optimization which leverages synthetic data for parameter selection.
✓ Why This Matters
Market shocks are what gets system traders in trouble. By generating synthetic data with your desired “shocks,” you can stress-test your strategy against the market you fear before it happens. This is preparing for the probable future, not optimizing for the certain past.
Integrating with the Full Workflow
Generate strategies across historical + synthetic data → Filter by OOS performance → Validate with Noise Test + Monte Carlo + Vs Random → Optimize parameters with NTO → Walk-forward with synthetic data → Deploy via automated code generation.
Build Alpha v3’s automated workflows run this entire pipeline. Set filters, hit simulate, and only see strategies that survive everything — including training across the multiverse.
Takeaways
✓ Key Takeaways
- Training on synthetic data is pre-simulation — fundamentally different from post-simulation robustness tests
- Three built-in methods: Vs Shifted, Noise Adjusted, Monte Carlo Permutation — plus GANs, deep learning, and custom imports
- BSK results show performance across all paths; color-coded equity curves reveal method-specific behavior
???? Need to Know
- Building on a variety of synthetic methods diversifies away pitfalls from any single generation approach
- Synthetic data integrates with walk-forward optimization — results count in pass/fail scoring
- Combine with the full robustness testing suite for maximum confidence before live deployment
Synthetic Data FAQ
Related Deep Dives
![]()
David Bergstrom
A decade-plus in professional trading as a market maker and quantitative strategy developer at a high-frequency trading firm with a CME seat. Self-taught C++, C#, and Python programmer specializing in data science, machine learning, and trading strategy development.
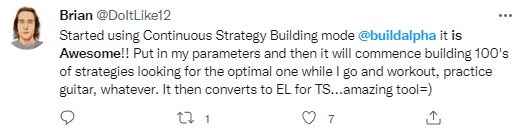
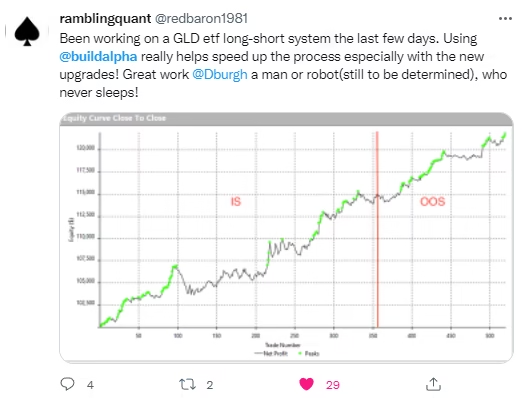
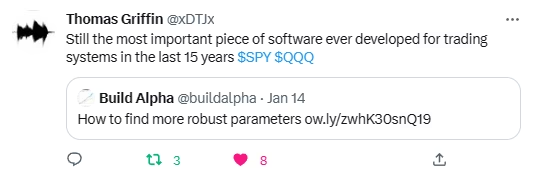
What Traders Say About Build Alpha


Train for the Unknown Future
Build strategies across hundreds of alternate price paths. Three generation methods. Custom stress rules. No coding required.